
A confirmation fraction is descriptive evidence
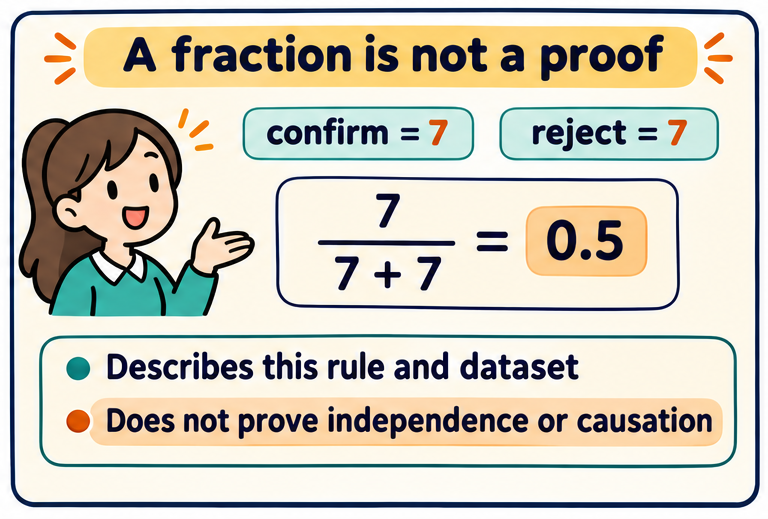
The lecture uses confirmation versus rejection as a systematic way to examine a hypothesis. It is useful to state the eligible group, the grading rule, the matching rule and the final counts. That makes the calculation reproducible and exposes counterexamples.
A 50% confirmation rate does NOT by itself prove random chance, no correlation or independence. Expected rates depend on the grade distributions and on which students were selected. Likewise, 80% is not automatically statistically significant. Those conclusions need a suitable baseline or statistical analysis beyond this counting exercise.
With the explicit whole-run extension, the stricter Maths-to-Physics result is 7/15; the reverse direction is 7/16. The looser top-half rule gives 8/15 and 8/16 respectively. These differences show why the denominator and preprocessing policy must be reported.
Association is not causation. This exercise does not establish that studying one subject causes performance in another. Its computational lesson is to turn an informal claim into a precise, testable procedure and then interpret only what its result supports.
Try it yourself
Why is 7/14 not proof of independence?
Show explained answer
One descriptive success rate does not compare the full joint distribution with an independence model.
Try it yourself
Why should you report the tie policy?
Show explained answer
Changing grade groups can change the eligible population and resulting fraction.
Try it yourself
What does a counterexample to a universal claim establish?
Show explained answer
It shows the claim is not universally true in these data. It does not by itself quantify the strength of every possible association.