
Scatterplots: keep the numerical pairs together
On this page 4 headings
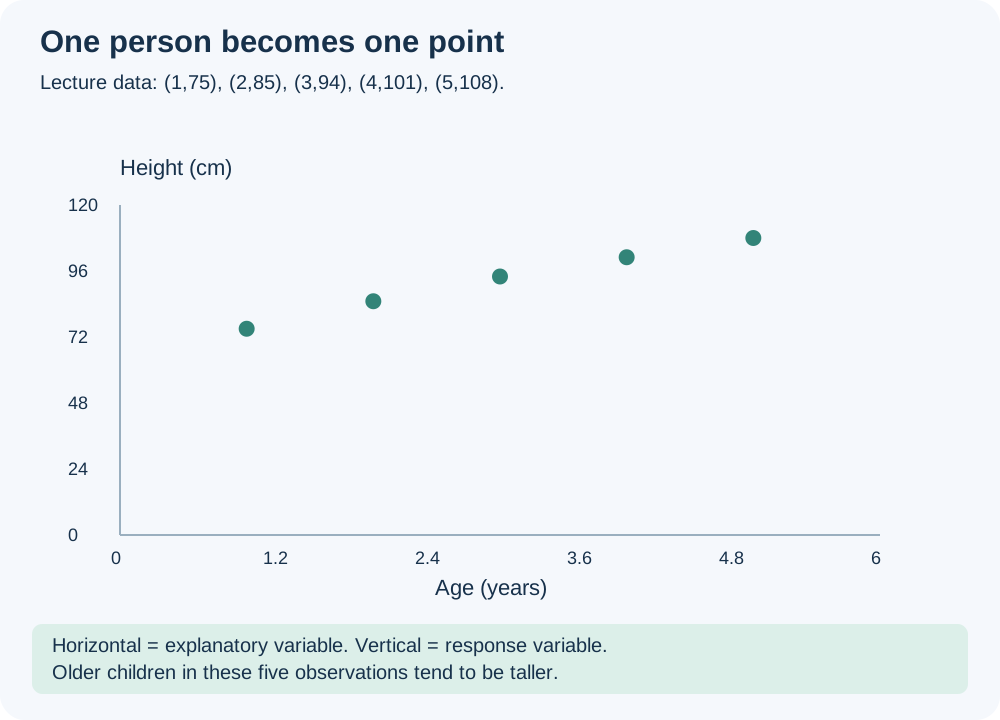
A scatterplot displays pairs of numerical values as points. Each point represents one case. Its horizontal position gives one measurement, and its vertical position gives the other.
Choose x and y from the question
Put the explanatory variable on the x-axis: the variable used to help explain or predict. Put the response variable on the y-axis: the outcome you want to describe. For predicting a house price from its size, size is x and price is y. These names do not prove cause and effect.
Worked example: age and height
| Age x (years) | Height y (cm) | Point |
|---|---|---|
| 1 | 75 | (1,75) |
| 2 | 85 | (2,85) |
| 3 | 94 | (3,94) |
| 4 | 101 | (4,101) |
| 5 | 108 | (5,108) |
For the child aged 2, move to x = 2 and up to y = 85; plot one dot. Repeat for every child. Do not connect the points as a time-series line: these are separate paired observations. A rising pattern suggests that higher age goes with higher height in this dataset.
Worked example: house size and price
The lecture records 15 houses. Size is in thousands of square feet, and price is in lakhs of rupees. A size of 2.3 means 2,300 square feet, not 2.3 square feet.
| Size (1,000 sq ft) | Price (lakh rupees) |
|---|---|
| 0.8 | 68 |
| 1.0 | 81 |
| 1.1 | 72 |
| 1.3 | 91 |
| 1.6 | 87 |
| 1.8 | 56 |
| 2.3 | 83 |
| 2.3 | 112 |
| 2.5 | 93 |
| 2.5 | 98 |
| 2.7 | 136 |
| 3.1 | 109 |
| 3.1 | 122 |
| 3.2 | 159 |
| 3.4 | 170 |
Two houses can have the same size but different prices: size 2.3 has prices 83 and 112. A relationship need not determine an exact response. Knowing size can help a prediction while leaving considerable variation.
Make and read the plot
Use paired x and y columns, choose a scatter chart, and check which column is on each axis. Label the title and both units. Keep pairs together when sorting or removing missing data. The visual test is: if you know x, does the pattern help you guess y?
Try it yourself
For a scatterplot of study hours and exam marks, predicting marks from hours, which variable goes on y?
Show explained answer
Exam marks are the response and go on y. Study hours are explanatory and go on x.
Try it yourself
Is the point (2.5,98) a house of 98 square feet costing 2.5 lakh?
Show explained answer
No. With the lecture axes it is a 2,500-square-foot house priced at 98 lakh.
Try it yourself
May you sort the x column alone before plotting?
Show explained answer
No. That destroys the original pairing and may create a false association.
Source: Lecture 4.4. Extra examples and diagrams are teaching material prepared for these notes.