
Revision and practice with answers
On this page 3 headings
Try these questions without looking at the answers. Then open each explanation and check your method, units and denominator.
One-page method guide
| Pair or question | Method |
|---|---|
| Two categorical variables | Contingency table; compare conditional shares. |
| Two numerical variables | Scatterplot before covariance or correlation. |
| Direction without units | Sign of r. |
| Strength of linear association | Magnitude of r, alongside the plot. |
| Predict y from x | Fitted line; inspect residuals and range. |
| Two groups and numerical observations | Compare distributions; point-biserial for an explicit 0/1 code. |
Practice with explained answers
Try it yourself
1. A two-way row has Yes=12 and No=8. Find its within-row Yes share.
Show explained answer
12/(12+8) = 12/20 = 60%.
Try it yourself
2. If all rows have the same conditional percentages, what does that say about this table?
Show explained answer
The empirical category distributions are identical across rows, so knowing the row category gives no extra information about the column category.
Try it yourself
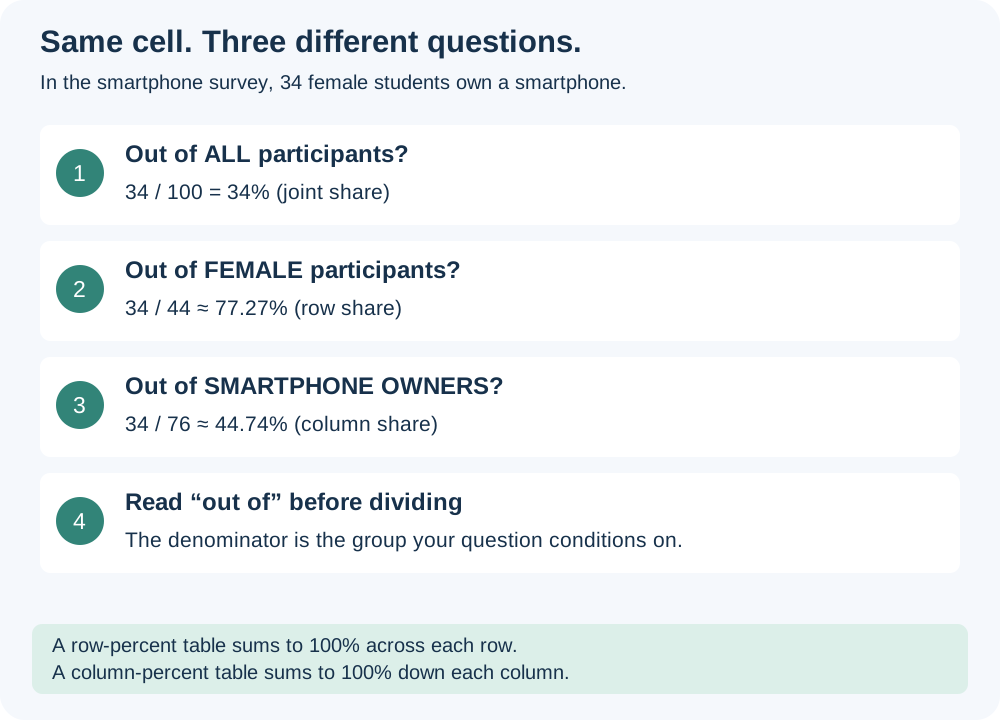
3. In the phone survey, distinguish 34/44 and 34/76.
Show explained answer
34/44 is ownership among female participants. 34/76 is the female share among owners. They condition on different groups.
Try it yourself
4. What should you describe before computing correlation?
Show explained answer
Direction, linearity or curvature, variation around the pattern, and unusual points.
Try it yourself
5. For (1,3),(2,2),(3,1), find sample covariance and correlation.
Show explained answer
Means are 2 and 2. Products are −1,0,−1. Sample covariance = −2/2 = −1. Each sample variance is 1, so r = −1.
Try it yourself
6. If one variable is converted from meters to centimeters, what happens to covariance and correlation?
Show explained answer
Covariance is multiplied by 100. Correlation is unchanged because standardization cancels the positive scale change.
Try it yourself
7. What if r=0 but the scatterplot is a clear U-shape?
Show explained answer
There is a nonlinear association. Pearson r only summarizes a linear relationship.
Try it yourself
8. Predicted y = 10+3x. At x=4, actual y=20. Find predicted y and residual.
Show explained answer
Predicted y = 22. Residual = observed−predicted = 20−22 = −2.
Try it yourself
9. A simple fitted line with intercept has r=−0.6. Find R² and interpret it.
Show explained answer
R² = 0.36. The line accounts for 36% of observed response variation relative to the mean-only prediction. The direction is negative.
Try it yourself
10. Does R²=0.9 mean that 90% of individual predictions are exactly correct?
Show explained answer
No. It describes variation accounted for by the fitted model, not the percentage of correct predictions.
Try it yourself
11. With F=0 and M=1, point-biserial r is +0.1881. What happens if the codes are reversed?
Show explained answer
The value becomes −0.1881. Coding changes the sign; the underlying group difference is unchanged.
Try it yourself
12. What happens if every x value is identical?
Show explained answer
SD of x is zero, so correlation is undefined and a unique regression slope cannot be calculated.
Try it yourself
13. Why can the largest ownership count belong to a group without the largest ownership rate?
Show explained answer
The group may simply be larger. Compare within-group shares using each group’s own total.
Try it yourself
14. Can a fitted line prove causation or guarantee a prediction far outside the data?
Show explained answer
No. A fitted association does neither. Inspect context, possible other variables and the observed range.
Before moving on
Explain one result in a complete sentence with the group, unit and method. If your result disagrees with a spreadsheet, check the definition, sample/population denominator and percentile convention before changing your answer.