
Describe association: direction, shape, spread, outliers
On this page 6 headings
Before calculating a coefficient, describe the scatterplot. A single number cannot capture every feature of a relationship.
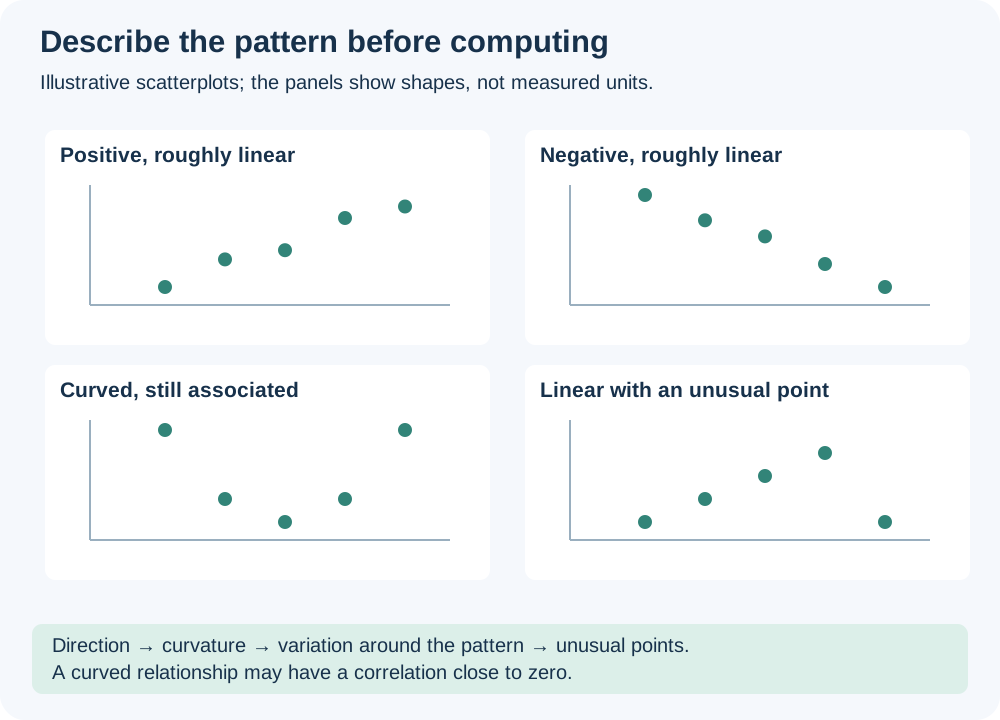
1. Direction: upward, downward or neither?
A positive association rises: larger x tends to go with larger y. Child age and height can show this pattern. A negative association falls: larger x tends to go with smaller y, as in age and resale price of cars. A U-shaped pattern changes direction, so one “positive” or “negative” label is incomplete.
2. Curvature: straight or bent?
A roughly linear cloud follows a straight-line trend. A curved pattern may flatten, accelerate, or turn. A strong curve is still an association, even when a straight-line correlation is small.
3. Variation: how close are points to the pattern?
A tight cloud around a trend gives more precise predictions than a widely scattered cloud. “Strong” describes closeness to a pattern, not how steep a line looks. The same relationship can look steeper if you stretch the vertical axis.
4. Outliers: what seems unexpected?
Look for points far from the overall pattern or far from the rest of the x-values. A high-priced house is not automatically unusual if it is also very large. A surprisingly low price for a large house may be unusual relative to the pattern. Check data entry, units and possible explanations before deleting anything.
Worked description for the housing example
In the lecture’s housing data, price generally rises with size. The pattern is roughly linear but has noticeable variation. The house at size 1.8 and price 56 sits relatively low. Describe it as a point to investigate, not automatically as a mistake. Size alone does not explain every price.
Avoid two common conclusions
An association does not establish causation. Other variables, selection effects or chance can contribute. Also, absence of a visible straight line does not prove that the variables are unrelated: a curve, subgroups, or a restricted range can hide a relationship.
Try it yourself
Points form a tight downward line. Describe direction, form and variation.
Show explained answer
Negative direction, approximately linear form, and little variation around the line: a strong negative linear association.
Try it yourself
A U-shaped scatterplot has correlation near zero. Is the graph necessarily random?
Show explained answer
No. A clear U-shape is a nonlinear association that a linear correlation can miss.
Try it yourself
Does a steep slope automatically mean a stronger association?
Show explained answer
No. Strength concerns how tightly points follow the pattern; slope depends on units and axis scales.
Source: Lecture 4.5. Extra examples and diagrams are teaching material prepared for these notes.