
A category and a number: compare groups
On this page 6 headings
When one variable is a category and the other is numerical, compare the numerical distributions within the categories. Begin with the dots and group summaries before reducing the result to one number.
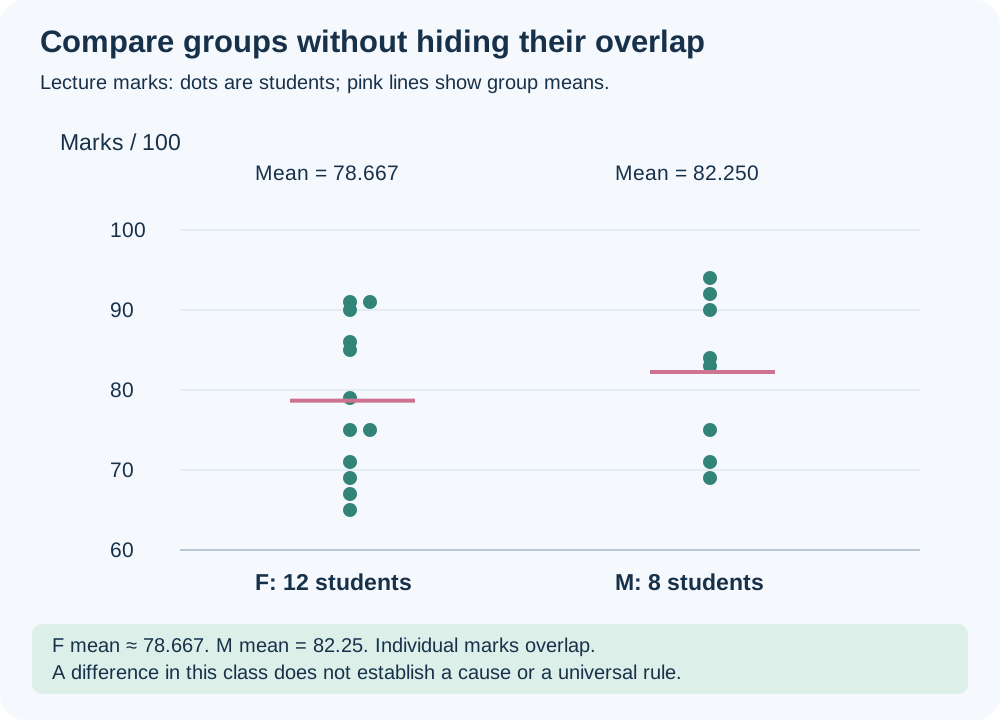
Worked example: the lecture’s twenty students
| Group | Marks out of 100 | Count | Total | Mean |
|---|---|---|---|---|
| F | 71,67,65,91,85,69,75,79,86,75,90,91 | 12 | 944 | 944/12 ≈ 78.667 |
| M | 69,75,83,92,71,94,84,90 | 8 | 658 | 658/8 = 82.25 |
In these data the M group has the higher mean by about 3.583 marks. That is a description of this class, not a claim about every individual or a cause of performance. Many marks overlap across groups.
Show the groups rather than a misleading line
Place the category labels on one axis and marks on the other. Plot each student as a dot, offsetting duplicates slightly so they remain visible. Side-by-side boxplots are useful with larger groups. Compare center, spread, shape, overlap and unusual observations; do not compare means alone.
Two categories: a 0/1 code
A dichotomous variable has two categories. Code them 0 and 1, and record which category each code means. Coding labels does not turn them into a measured amount. With two categories, Pearson correlation between the 0/1 code and the numerical marks is called point-biserial correlation.
Compute point-biserial correlation consistently
Let X be the numerical marks and Z the category code. Let mean X₀ and mean X₁ be the mark means in groups 0 and 1, and p₀ and p₁ their proportions. Using SD computed over all observations with divisor n (written σX here), Pearson correlation with code Z is:
If you instead use the sample SD sX with divisor n−1, include the finite-sample factor:
The two formulas give the same result. Here n₀ and n₁ are the two group counts and n = n₀+n₁. Do not use the sample SD in the first formula without adjusting the factor.
Calculate it for these students
Choose F = 0 and M = 1. Then n₀ = 12, n₁ = 8, p₀ = 0.6 and p₁ = 0.4. The mean difference X₁−X₀ is 82.25−78.6667 ≈ 3.5833. The all-student SD with divisor 20 is about 9.3322.
This small positive value says the group coded 1 has the higher mean here, with substantial within-group variation. Changing the code to F = 1 and M = 0 gives −0.1881. The underlying difference and its magnitude do not change.
Source clarification: the slide writes group-0 mean minus group-1 mean and uses an unspecified SD. To reproduce Pearson/CORREL with code 1, use the group-1-minus-group-0 order and a matching SD formula as above. A 0-minus-1 contrast reverses the sign. Always state both the coding and the denominator convention.
Practical checks
Put a complete 0/1 code column beside the paired numerical column and calculate CORREL on the matching rows. Each group must contain observations, and the numerical variable must vary. With more than two nominal categories, arbitrary codes such as 1,2,3 are not a justified substitute for a group comparison; start with separate group distributions.
Try it yourself
If a binary code is reversed, what happens to point-biserial r?
Show explained answer
Its sign reverses and its magnitude stays the same. A positive sign is meaningful only after the coding is stated.
Try it yourself
Does a higher group mean imply every person in that group scored higher?
Show explained answer
No. Individual distributions can overlap substantially, as in the lecture marks.
Try it yourself
Can you compute this two-group coefficient when all observations have code 0?
Show explained answer
No. There is no second group and the code has zero variance, so Pearson correlation is undefined.
Source: Lecture 4.9. Extra examples and diagrams are teaching material prepared for these notes.