
Two-variable questions and contingency tables
On this page 5 headings
So far we have described one variable at a time. Now we ask whether two characteristics vary together. For example, does smartphone ownership differ across income groups? We need two values recorded for the same case.
A quick review before starting
| Earlier idea | Why it matters now |
|---|---|
| Case and variable | Keep both values paired with the correct person. |
| Categorical or numerical | The variable types determine the table or graph. |
| Frequency and relative frequency | Counts summarize cases; shares allow fair group comparisons. |
| Mean, median, spread and percentiles | Use these to compare numerical distributions within groups. |
Choose the method from the variable types
| Variable pair | First tool | Examples |
|---|---|---|
| Categorical + categorical | Two-way contingency table | Income group and phone ownership |
| Numerical + numerical | Scatterplot | House size and price |
| Categorical + numerical | Separate group distributions | Group label and exam marks |
A contingency table counts combinations
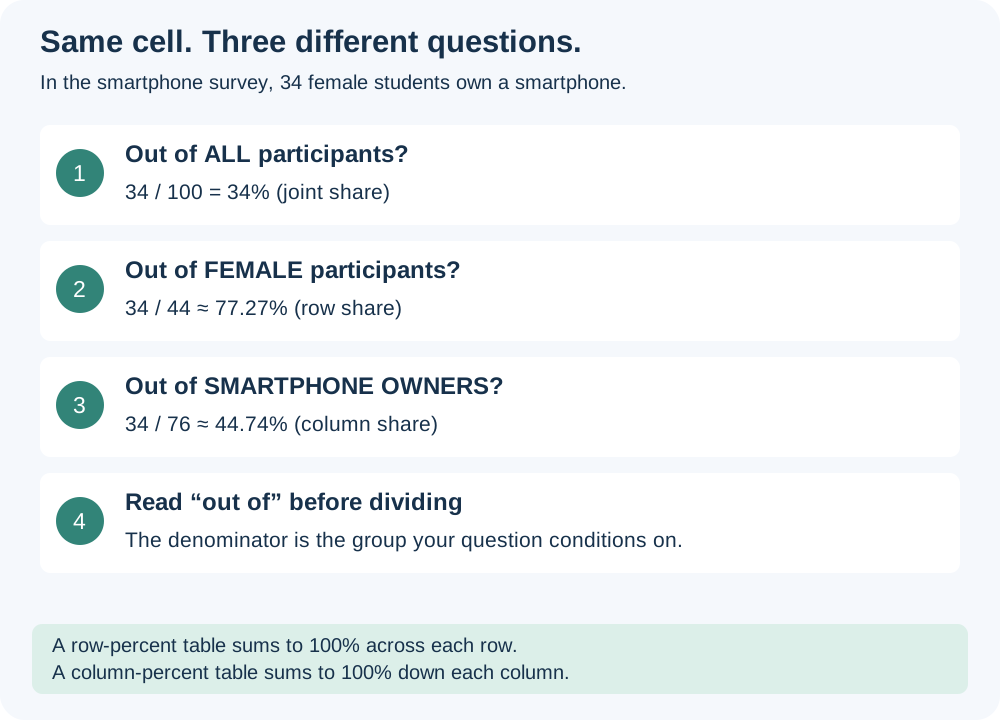
Each interior cell counts cases with both its row category and its column category. Row and column totals are marginal totals; the bottom-right number is the grand total. Each case is counted once in the body of a complete two-way table.
| Gender in lecture survey | No phone | Owns phone | Row total |
|---|---|---|---|
| Female | 10 | 34 | 44 |
| Male | 14 | 42 | 56 |
| Column total | 24 | 76 | 100 |
Of the 100 surveyed students, 44 are female, 56 are male, and 76 own phones. The missing female/non-owner cell is 44−34 = 10. The male/non-owner cell is 56−42 = 14. Check 10+34+14+42 = 100.
A second example: income and ownership
| Income group | No phone | Owns phone | Total |
|---|---|---|---|
| Low | 9 | 5 | 14 |
| Medium | 27 | 39 | 66 |
| High | 2 | 18 | 20 |
| Total | 38 | 62 | 100 |
Income group is ordinal, so retain Low, Medium, High (or the reverse order). Ownership is nominal. The largest owner count is Medium = 39, but that group also contains the most people. Counts alone do not tell us which income group has the highest ownership share.
Create a two-way summary in a spreadsheet
Begin with one row per participant and a column for each variable. In a pivot table, place one variable in Rows and the other in Columns. Set Values to count a complete ID or category field, using a count appropriate for text. Check blanks and totals. Do not add the Total row as if it were another observation when graphing.
Try it yourself
In the income table, how many participants are both low income and non-owners?
Show explained answer
9. This is the intersection of the Low row and No phone column.
Try it yourself
A row total is 30 and its Yes count is 18. Find No.
Show explained answer
30−18 = 12, assuming Yes and No cover every response exactly once.
Try it yourself
Can house size and house price be analyzed by a category contingency table without changing them?
Show explained answer
They are numerical variables, so a scatterplot is the natural starting point. Binning them into categories loses detail.
Source: Lectures 4.1 and 4.2. Extra examples and diagrams are teaching material prepared for these notes.