
Revision and practice with answers
On this page 4 headings
Use this page after the lessons. Attempt each question before opening its answer.
Quick revision
| Idea | Remember |
|---|---|
| Frequency | Count the cases in each category. |
| Relative frequency | Count divided by group total. |
| Percent / pie angle | Share × 100% / share × 360°. |
| Bar / pie / Pareto | Compare categories / parts of whole / descending counts. |
| Ordinal charts | Keep the natural category order. |
| Fair chart | Clear labels, honest areas and zero-baseline bars. |
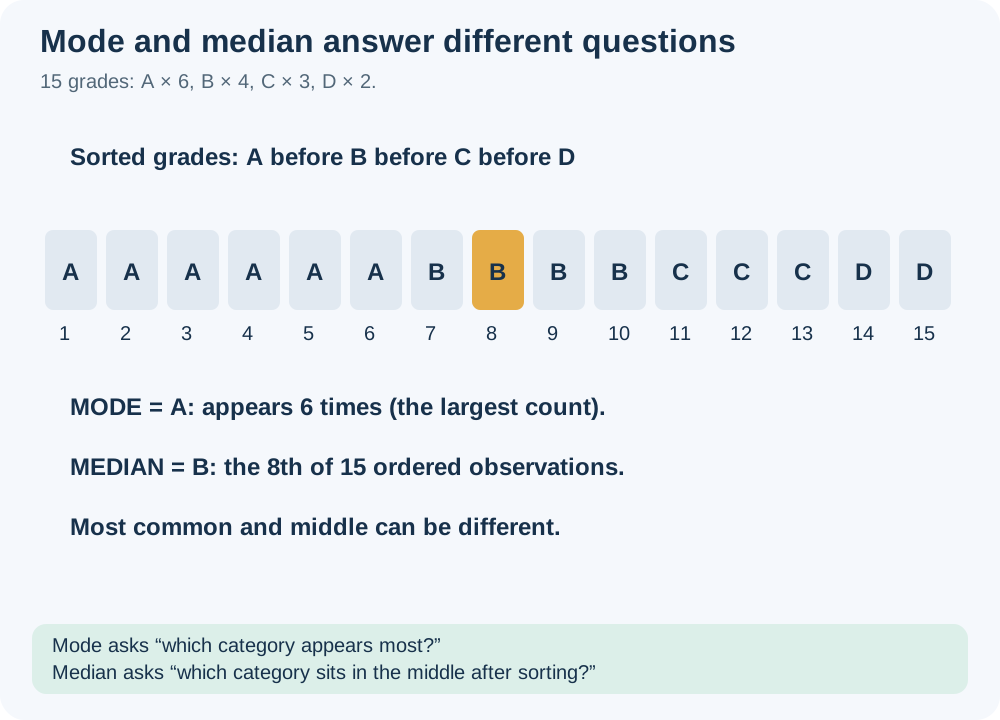
| Mode / median | Most common / middle category after sorting. |
Practice with explained answers
Try it yourself
1. Count A,B,A,C,B,A,D,C,A,D,A,B.
Show explained answer
A = 5, B = 3, C = 2, D = 2; total = 12.
Try it yourself
2. Find the shares and percentages for question 1.
Show explained answer
A: 5/12 ≈ 41.67%. B: 3/12 = 25%. C and D: each 2/12 ≈ 16.67%. Rounded percentages total 100.01%.
Try it yourself
3. Find the pie angles for question 1.
Show explained answer
A = 150°, B = 90°, C = 60°, D = 60°; total = 360°.
Try it yourself
4. Which category is the mode in question 1?
Show explained answer
A. The mode is the category; 5 is its frequency.
Try it yourself
5. Counts are X = 10, Y = 40, Z = 20. Give Pareto order.
Show explained answer
Y, Z, X, with counts 40,20,10.
Try it yourself
6. Two bars represent 50 and 60 but start at 40. What impression can they create?
Show explained answer
Visible heights are 10 and 20, suggesting a doubling. The true increase is 10/50 = 20%.
Try it yourself
7. Ordered responses are Poor,Poor,Fair,Good,Good,Good,Excellent. Find mode and median.
Show explained answer
Mode = Good, appearing 3 times. Median = the 4th ordered response = Good.
Try it yourself
8. A multiple-choice survey allows more than one favorite sport. Should percentages that total 150% form one pie?
Show explained answer
No. Overlapping responses do not form mutually exclusive parts of one 100% whole.
Try it yourself
9. For ordinal responses S,S,M,L,L,L, what are the middle categories?
Show explained answer
Positions 3 and 4 are M and L. Report both; do not average label codes. Follow the course convention if a single median is requested.
More practice: apply what you learned
Try it yourself
10. Count Tea,Coffee,Tea,Juice,Tea,Coffee,Juice,Tea,Coffee,Tea.
Show explained answer
Tea = 5, Coffee = 3, Juice = 2; total = 10. Check that 5+3+2 = 10.
Try it yourself
11. For question 10, find relative frequencies and percentages.
Show explained answer
Tea: 5/10 = 0.5 = 50%. Coffee: 3/10 = 0.3 = 30%. Juice: 2/10 = 0.2 = 20%. The exact shares sum to 1, and the percentages to 100%.
Try it yourself
12. For question 10, calculate all pie angles.
Show explained answer
Tea: 0.5×360° = 180°. Coffee: 0.3×360° = 108°. Juice: 0.2×360° = 72°. Total = 360°.
Try it yourself
13. For question 10, identify the mode and decide whether it is a majority.
Show explained answer
Mode = Tea. Its share is exactly 50%, so it is half the group, not a strict majority. A majority requires more than 50%.
Try it yourself
14. A category has frequency 7 in 28 responses. Find its share, percentage and pie angle.
Show explained answer
Share = 7/28 = 0.25; percentage = 25%; angle = 0.25×360° = 90°.
Try it yourself
15. A chart says 30% of 50 students chose A. How many students is that?
Show explained answer
0.30×50 = 15 students. Multiplying the proportion by the total recovers the category count.
Try it yourself
16. One group has 18 of 30 using the library; another has 24 of 60. Which has the larger count and which the larger share?
Show explained answer
The second has the larger count (24 versus 18). The first has the larger share: 18/30 = 60%, compared with 24/60 = 40%.
Try it yourself
17. A bar chart uses relative frequency. The heights are 0.2,0.5,0.3. What are the corresponding percentages?
Show explained answer
20%,50%,30%. Multiply each proportion by 100%. The bar heights already sum to 1.
Try it yourself
18. Defect counts are A=3,B=8,C=5,D=1. Give Pareto order and the mode.
Show explained answer
Pareto order: B,C,A,D. Mode = B, with the highest frequency 8.
Try it yourself
19. A pie chart shows shares 45%,35%,30%. Is this a complete, non-overlapping one-response distribution?
Show explained answer
No. The total is 110%, too far from 100% to be ordinary rounding. Check overlapping responses, wrong denominators or a data error.
Try it yourself
20. Three equal shares are displayed as 33.3% each. Explain the total.
Show explained answer
They total 99.9% because each exact share 1/3 was rounded. The original shares still sum to 1. Calculate from exact counts or unrounded shares.
Try it yourself
21. A picture grows from width 2 cm and height 3 cm to width 4 cm and height 6 cm. How much did its area change?
Show explained answer
Original area = 2×3 = 6 cm². New area = 4×6 = 24 cm², four times as large. It would exaggerate data that only doubled.
Try it yourself
22. With order Poor<Fair<Good<Excellent, responses are Poor,Fair,Good,Good,Excellent. Find mode and median.
Show explained answer
Mode = Good, appearing twice. The 5 observations are already ordered; median is position 3 = Good.
Try it yourself
23. With grade order A,B,C,D, data are A,A,A,A,B,B,C. Find mode and median.
Show explained answer
Mode = A (4 times). Median is position 4 of 7 = A. Do not confuse position 4 with grade D.
Try it yourself
24. Ordered responses are Low,Low,Medium,High. What are the middle categories, and can you average their codes?
Show explained answer
Positions 2 and 3 are Low and Medium. Report both middle categories and follow the course convention if one is requested. Averaging arbitrary codes does not create a meaningful halfway category.
Try it yourself
25. Counts are A=4,B=4,C=2. What are the modes?
Show explained answer
A and B tie for the highest frequency, so both are modes: the data are bimodal. Do not choose one arbitrarily.
Ready to move on?
Explain each answer in your own words. If you cannot explain the denominator, category order or measurement scale, revisit that lesson before continuing.