
Frequency tables: count each category
On this page 4 headings
A frequency is a count. A frequency distribution lists the different categories and how many observations belong to each. It turns a long list of labels into a short, useful summary.
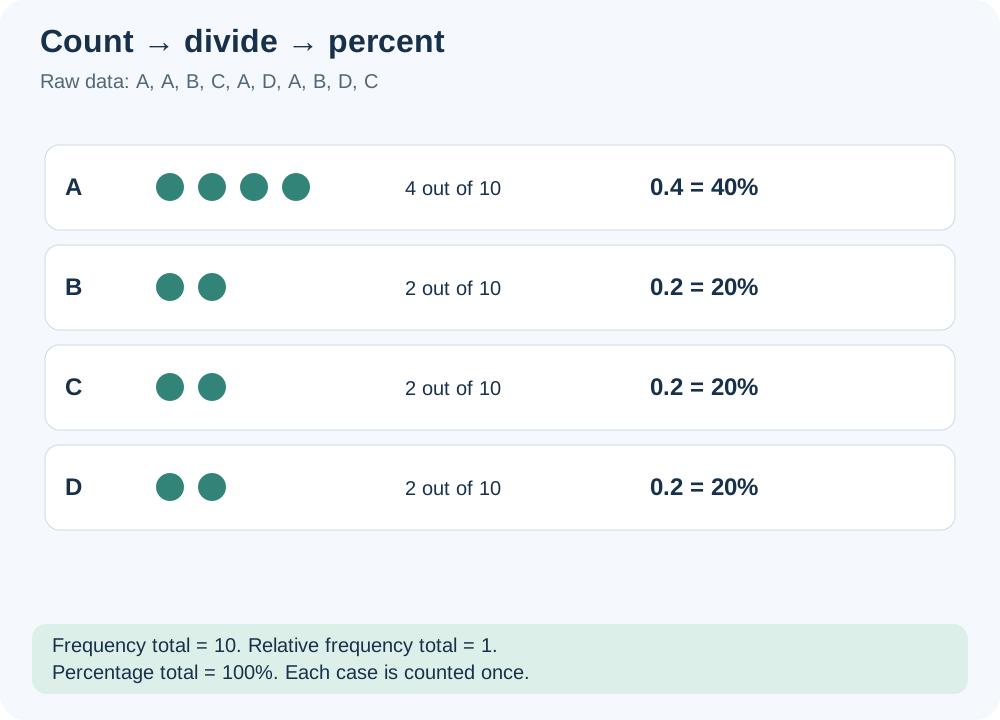
Build a table one observation at a time
Use the list A, A, B, C, A, D, A, B, D, C. First list the distinct categories A, B, C and D. Next read each observation once and add a tally in the matching row. Finally count the tallies.
| Category | Tally | Frequency |
|---|---|---|
| A | |||| | 4 |
| B | || | 2 |
| C | || | 2 |
| D | || | 2 |
| Total | 10 |
The total number of observations is often written n. Here n = 10, and 4 + 2 + 2 + 2 = 10. For this single-response variable, each case belongs to exactly one category. Categories should not overlap or leave observed values out.
The lecture’s practice lists, counted carefully
| List | A | B | C | D | Total |
|---|---|---|---|---|---|
| 1: A,A,B,C,A,D,A,B,D,C | 4 | 2 | 2 | 2 | 10 |
| 2: list 1 followed by A,B,C,D,A | 6 | 3 | 3 | 3 | 15 |
| 3: A,B,B,C,A,D,B,B,D,C,A,B,C,D,B | 3 | 6 | 3 | 3 | 15 |
| 4: list 2 followed by C,D,D | 6 | 3 | 4 | 5 | 18 |
Source clarification: the opening exercise slide in Lecture 2.1 prints a different third list, A,A,B,C,A,A,B,B,D,C,A,B,C,D,B. That list has A = 5, B = 5, C = 3, D = 2. The later worked table uses the third list shown above, with counts 3,6,3,3. Always count the actual list you are given.
A spreadsheet method
A pivot table can do the same counting: use the category as the row field and count the category entries as the value. Check that the result counts text entries rather than trying to sum them, and check whether blanks were included. The exact menu position depends on the spreadsheet app.
Try it yourself
Count Red, Blue, Red, Green, Blue, Red.
Show explained answer
Red = 3, Blue = 2, Green = 1; total = 6.
Try it yourself
A table for 18 single-response cases has counts 6,3,4,4. Is it complete?
Show explained answer
No. The counts sum to 17. Recheck for an omitted or misclassified observation.
More practice: apply what you learned
Try it yourself
Make a frequency table for Bus,Walk,Bus,Cycle,Walk,Bus,Cycle,Bus.
Show explained answer
Bus = 4, Walk = 2, Cycle = 2. Total = 8. Each response belongs to one transport category and is counted once.
Try it yourself
A list contains 4 cats, 3 dogs and 2 birds. How many observations should the frequency total show?
Show explained answer
4 + 3 + 2 = 9. If the total is different, check for a missed or duplicated observation.
Source: Lecture 2.1.pdf. Explanations, diagrams and extra practice are prepared for these notes.