
Read charts carefully: avoid misleading graphs
On this page 6 headings
A chart should make the data easier to understand. Its appearance should not exaggerate a difference, hide a category, or make a different group look like the one you meant.
Begin with the purpose and the labels
Use a pie to show parts of a whole and a bar chart to compare groups. Name the categories and say whether the values are counts, shares, or percentages. State which cases are included. If only one intake or one region is shown, put that in the title or caption.
Too many categories can hide the message
When there are many small categories, a chart becomes hard to read. You may group some as “Other”, but explain what it contains and keep the underlying counts available. Do not silently omit inconvenient categories. Keep important distinctions when they matter to the question.
The area principle
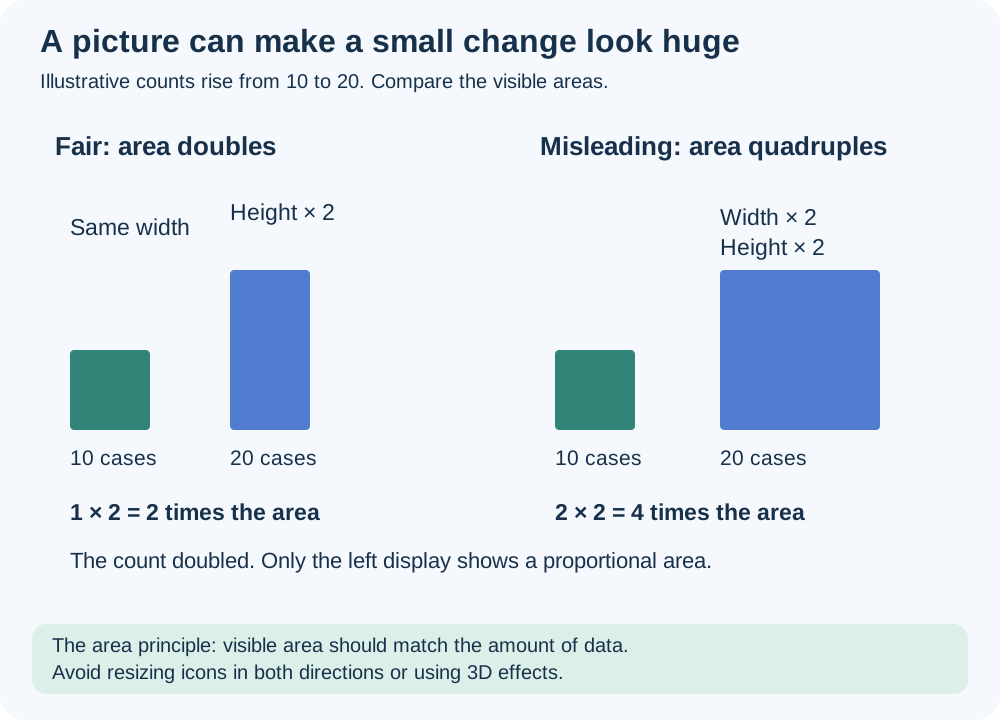
The area principle says the amount of visible area should match the amount of data. If a count doubles, doubling both the width and height of an icon multiplies its area by four, exaggerating the change. Equal-width bars avoid this problem because their areas grow with their heights. Decorative bottles, pictures, 3D slices and perspective can distort comparisons.
Truncated axes can exaggerate differences
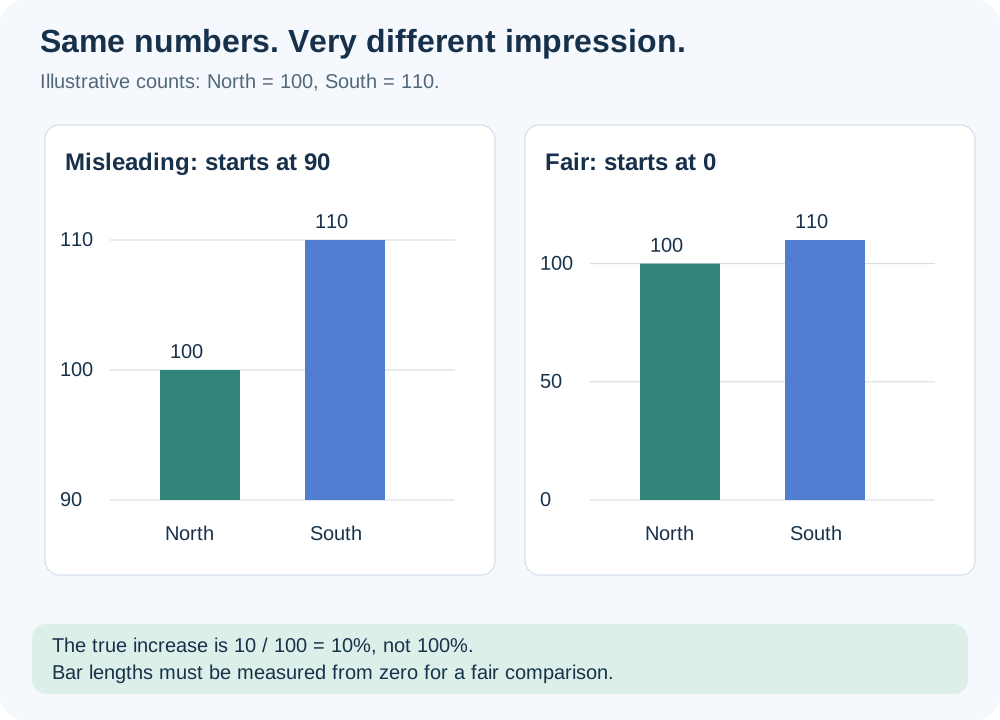
For North = 100 and South = 110, South is 10% larger. If a bar axis starts at 90, visible heights are 10 and 20, which look twice as large. A zero baseline gives the correct bar-length comparison. This is why bar charts should normally start at zero.
If an axis is shortened or broken, show a clear break symbol and explain the scale change. A break warns the reader; it does not make bar lengths proportional again. For an ordinary category comparison, a zero-baseline chart is clearer. In a timeplot, a narrower labeled vertical range may help show changes, but readers still need to inspect it.
Rounding is different from missing data
Three equal shares rounded to one decimal place become 33.3%,33.3%,33.3%, totaling 99.9%. Explain rounding and calculate chart angles from unrounded values. A large discrepancy should be investigated, not dismissed as rounding.
| Before trusting a graph, check… | Ask… |
|---|---|
| Purpose | Does this chart answer the stated question? |
| Labels and group | What is counted, in what unit, among whom? |
| Categories | Were some omitted or combined? |
| Baseline and scale | Do bar lengths begin at zero? Is a break shown? |
| Area and decoration | Does area match the count? |
| Totals | Do shares describe a whole? Is rounding explained? |
Try it yourself
An icon representing 20 cases is twice as wide and twice as tall as the icon for 10 cases. What is wrong?
Show explained answer
The count doubled, but the visible area became four times as large. The picture exaggerates the change.
Try it yourself
A percentage chart totals 99.9%. Is it necessarily wrong?
Show explained answer
No. Rounded percentages can total 99.9%. Check the exact counts and unrounded shares before deciding.
More practice: apply what you learned
Try it yourself
Two equal-width bars show counts 45 and 50, but the axis starts at 40. Compare the visible and actual ratios.
Show explained answer
Visible heights are 5 and 10, which look like a doubling. Actual ratio is 50/45 ≈ 1.111: the second count is only about 11.11% larger. A zero baseline gives a fair bar-length comparison.
Try it yourself
A chart is titled “All students”, but includes only students who answered a voluntary survey. What should the label say?
Show explained answer
It should say that it summarizes the survey respondents and give the relevant group or date. A voluntary survey is not automatically all students.
Source: Lecture 2.3 _ 2.4.pdf. Explanations, diagrams and extra practice are prepared for these notes.