
Pie charts: show parts of one whole
On this page 5 headings
A pie chart is a circle split into slices. Each slice has an area proportional to its category’s share. The entire circle represents the whole group, or 100%.
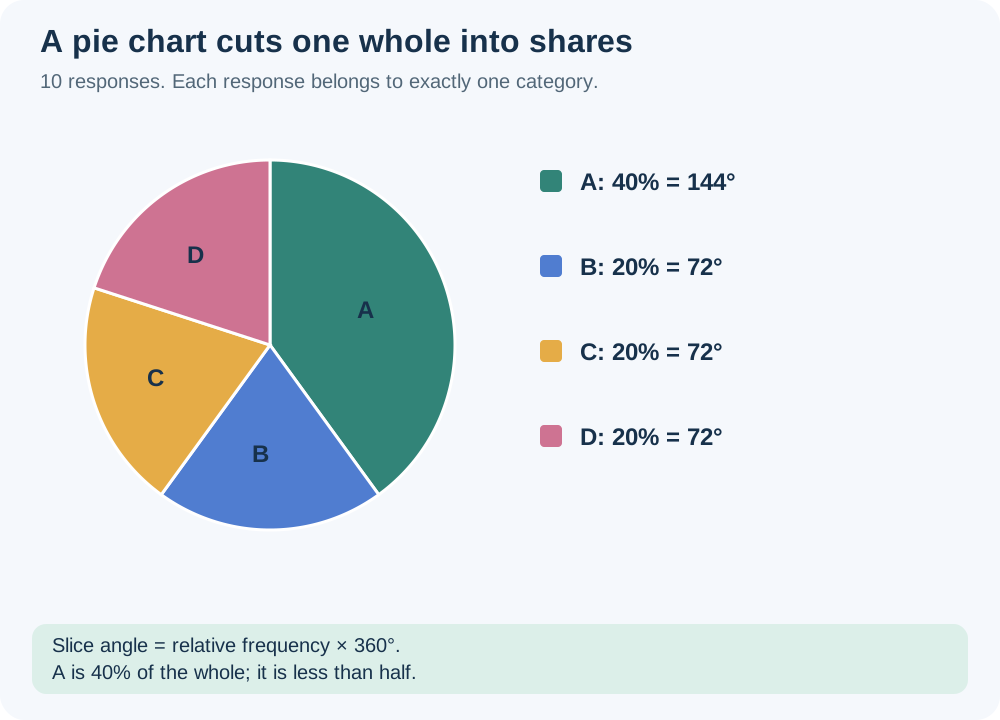
From a table to a circle
Start with a relative-frequency table. Multiply each share by 360° to get its slice angle. Draw the slices using a protractor, then label each category and its share.
| Category | Frequency | Share | Percent | Angle |
|---|---|---|---|---|
| A | 4 | 0.4 | 40% | 144° |
| B | 2 | 0.2 | 20% | 72° |
| C | 2 | 0.2 | 20% | 72° |
| D | 2 | 0.2 | 20% | 72° |
| Total | 10 | 1 | 100% | 360° |
With counts 6,3,3,3 out of 15, the slices are exactly the same: 40%,20%,20%,20%. A pie shows proportions, so different group sizes can produce the same pie.
Read the slice, not just its color
Half the circle is 50% or 180°. A share greater than 50% occupies more than half. In this example A is the largest category but is not a majority: 40% is less than 50%.
When a pie chart helps
A pie works best for a few categories that form one whole, especially when showing that a category is more than half. Comparing nearly equal slices is difficult; a bar chart usually makes small differences clearer. Avoid a pie for overlapping multiple-response categories because their percentages may exceed 100%.
Make it in a spreadsheet
Prepare category and count columns. Select the summary table without its Total row, insert a chart, and choose a pie chart. Label slices with category and percentage. Check that the chart represents the same group as the table and that no category was omitted.
Try it yourself
A category has 9 of 30 observations. What angle should its slice have?
Show explained answer
9/30 = 0.3, so the slice is 0.3 × 360° = 108°.
Try it yourself
The largest category is 45%. Is it a majority?
Show explained answer
No. It is the largest share, but a majority requires more than 50%.
More practice: apply what you learned
Try it yourself
A category is 25% of a group. What angle should its pie slice have?
Show explained answer
25% = 0.25. Angle = 0.25×360° = 90°, one quarter of a circle.
Try it yourself
A pie slice measures 180°. What share and percentage does it represent?
Show explained answer
180/360 = 0.5 = 50%. It represents half the whole, not more than half.
Source: Lecture 2.2.pdf. Explanations, diagrams and extra practice are prepared for these notes.