
Bar charts, Pareto charts and category order
On this page 4 headings
A bar chart compares categories using bar lengths. You can display counts, relative frequencies, or percentages. Tell the reader which one the axis uses.
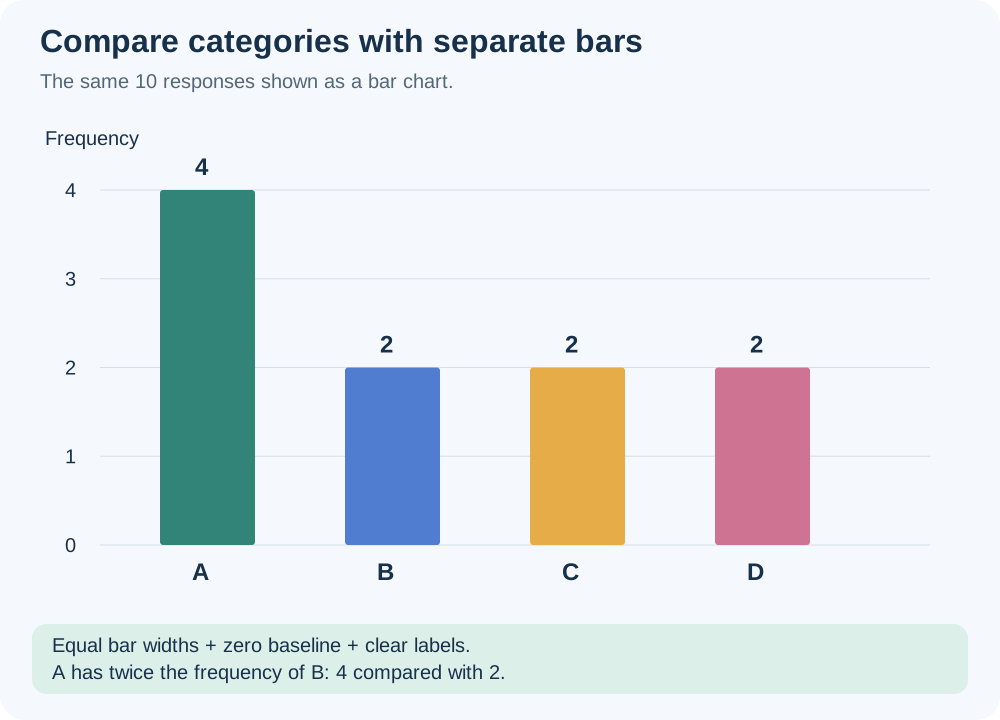
Build a bar chart
Start with the frequency table. Put category names on one axis and frequency on the other. Use equal-width bars, leave gaps between them, and make each bar height match its count. Label the variable, the measurement axis, and the group being summarized. Horizontal bars are useful for long category names.
For counts 4,2,2,2, A’s bar is twice as high as each other bar. A relative-frequency chart would use heights 0.4,0.2,0.2,0.2. A percentage chart would use 40,20,20,20. The pattern is the same because all values use the same denominator.
Pareto: sort by descending frequency
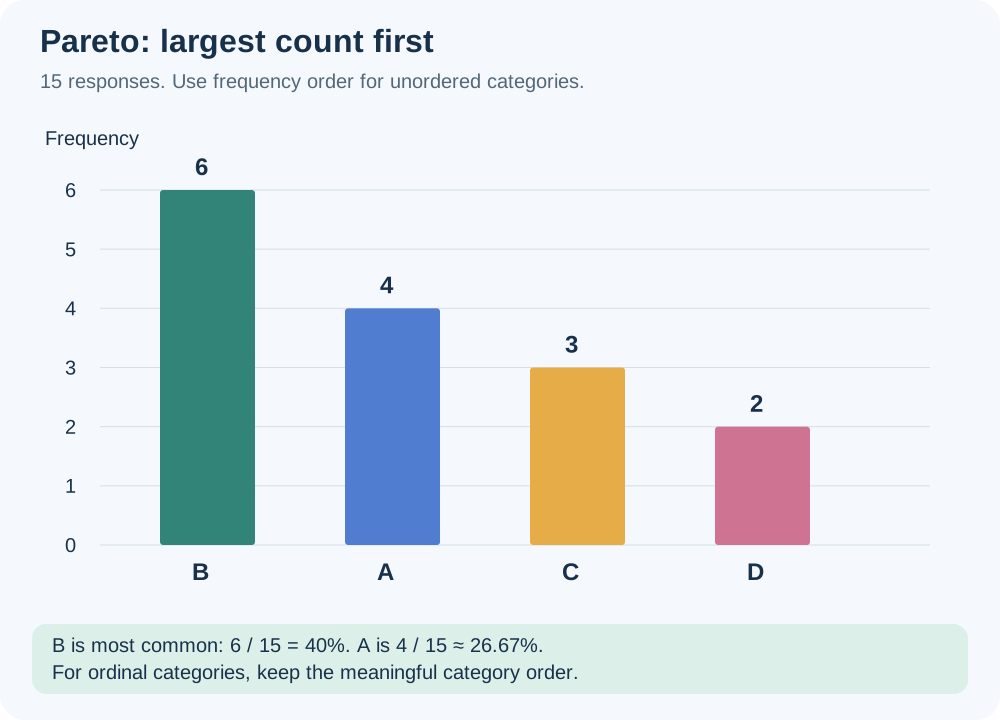
A Pareto chart is a bar chart arranged from highest frequency to lowest. It helps identify the most common problem or category, for example the defect that needs attention first. For the lecture list A,B,B,C,A,D,B,B,A,C,B,B,C,D,A, counts are A = 4, B = 6, C = 3 and D = 2.
| Category in Pareto order | Count | Exact share | Percent (rounded) |
|---|---|---|---|
| B | 6 | 6/15 | 40.00% |
| A | 4 | 4/15 | 26.67% |
| C | 3 | 3/15 | 20.00% |
| D | 2 | 2/15 | 13.33% |
Source clarification: the lecture displays A as 0.26 and D as 0.14. For the stated counts, the correct shares are 4/15 ≈ 0.2667 and 2/15 ≈ 0.1333. Use the counts to calculate accurately.
Ordinal categories keep their natural order
The lecture’s 20 T-shirt sizes are L,M,M,S,L,S,S,M,L,M,M,S,S,L,M,S,M,S,L,M. Counts are Small = 7, Medium = 8, Large = 5, giving 35%,40%,25%. Keep S,M,L on the axis rather than sorting M,S,L by frequency. Order is part of the information.
| Need | Suitable display |
|---|---|
| Compare category sizes precisely | Bar chart |
| Show shares of one whole with few categories | Pie chart |
| Find the most frequent unordered problems | Pareto chart |
| Display ordered categories | Bar chart in category order |
Try it yourself
Complaints are Delivery = 8, Payment = 3, Quality = 11. What is the Pareto order?
Show explained answer
Quality (11), Delivery (8), Payment (3).
Try it yourself
Should Poor, Fair, Good and Excellent be reordered by their counts?
Show explained answer
For an ordinal bar chart, preserve Poor, Fair, Good, Excellent so the ranking remains visible.
More practice: apply what you learned
Try it yourself
Defect counts are Scratch=5,Crack=9,Loose part=2. Give their Pareto order and name the most common defect.
Show explained answer
Crack (9), Scratch (5), Loose part (2). Crack is the most common defect. Pareto order runs from highest count to lowest.
Try it yourself
Sizes Small,Medium,Large have counts 9,3,7. What category order should an ordinal bar chart use?
Show explained answer
Small, Medium, Large (or the reverse). Preserve the meaningful size order rather than sorting by count.
Source: Lecture 2.2.pdf. Explanations, diagrams and extra practice are prepared for these notes.