
Mode and median: most common versus middle
On this page 6 headings
A descriptive measure is a compact summary of a dataset. Measures of central tendency describe a center or typical value. For categorical data, the mode is especially useful; for ordinal data, we can also find a median.
Mode means most common category
The mode is the category with the highest frequency. It names the tallest bar, widest pie slice, or first category in a descending Pareto chart. Give the category, not just its frequency.
For the lecture list A,A,B,C,A,D,A,B,C,C,A,B,C,D,A, counts are A = 6, B = 3, C = 4, D = 2. The mode is A because 6 is the highest count.
Ties: bimodal and multimodal
When exactly two categories tie for the highest frequency, report both modes: the data are bimodal. If more than two categories tie at the top, report all tied categories: multimodal. The lecture list A,A,B,C,A,C,A,B,C,C,A,C,C,D,A,A,C,D,B has A = 7, C = 7, B = 3, D = 2, so its modes are A and C.
If every category is equally frequent, no category stands out. Many introductory courses call this “no unique mode” or “no mode”. Always state the tie rather than choosing an arbitrary category.
Median requires a meaningful order
The median is the category at the middle of the sorted observations. Nominal blood groups have no meaningful order, so they have no meaningful median. Ordinal grades do: use the grade ranking provided. For these examples, use the order A, B, C, D.
For A,B,B,C,A,D,B,B,A,C,B,B,C,D,A, the counts are A = 4, B = 6, C = 3, D = 2. The sorted list is A,A,A,A,B,B,B,B,B,B,C,C,C,D,D. There are 15 observations, so the middle is position (15+1)/2 = 8. Position 8 is B. The median is B, and the mode is also B.
Even-sized ordinal data
For even n, inspect positions n/2 and n/2 + 1. The lecture’s 14-student example sorts to A,A,A,B,B,B,B,B,B,C,C,C,D,D. Positions 7 and 8 are both B, so the median is unambiguously B.
If the two middle categories differ, do not average their labels or codes. For Poor,Poor,Good,Excellent, the middle categories are Poor and Good. The supplied lecture allows the category on either side of the middle; report both middle categories and follow the course’s requested convention if one answer is required. There is no numerical halfway category justified by ordinal labels.
Mode and median need not agree
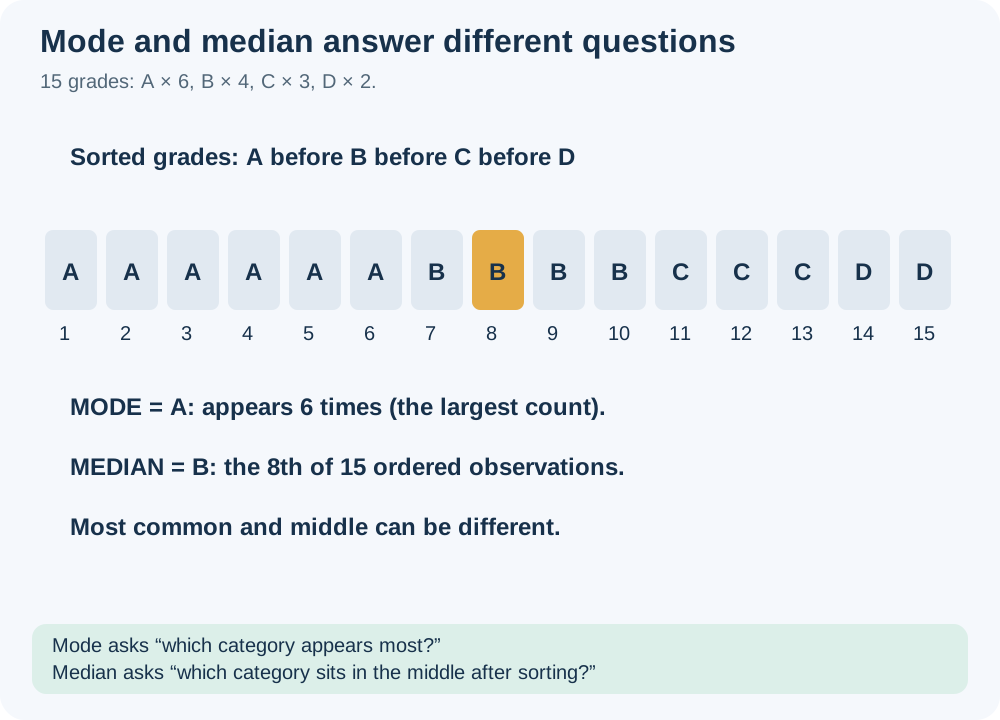
For A,B,B,C,A,D,A,B,A,C,B,A,C,D,A, counts are A = 6, B = 4, C = 3, D = 2. Positions 1–6 are A, 7–10 are B, 11–13 are C, and 14–15 are D. The 8th position is B, so the median is B; the mode is A.
| Summary | Question it answers | Allowed for nominal? | Allowed for ordinal? |
|---|---|---|---|
| Mode | Which category occurs most? | Yes | Yes |
| Median | Which category is in the middle after ordering? | No | Yes |
Try it yourself
Sizes S,S,M,M,M,L,L are ordered S < M < L. Find the mode and median.
Show explained answer
Mode = M (3 occurrences). Median = position 4 of 7 = M.
Try it yourself
For ordered grades A,A,A,A,B,C,C, what are the mode and median?
Show explained answer
Mode = A (4 occurrences). Median = position 4 of 7 = A.
Try it yourself
Blood groups A,B,O,O,AB: can you find a mode and median?
Show explained answer
Mode = O. A median is not meaningful because blood groups are nominal.
More practice: apply what you learned
Try it yourself
Ratings are Poor,Good,Good,Excellent,Good,Poor. Find the mode.
Show explained answer
Good appears 3 times, Poor 2 times, Excellent once. The mode is Good. Give the category, not just the count 3.
Try it yourself
Ordered sizes are S,S,S,M,M,L,L,L,L, with S<M<L. Find mode and median.
Show explained answer
Mode = L (4 occurrences). There are 9 observations, so median is position (9+1)/2 = 5, which is M. Most common and middle differ.
Source: Lecture 2.5.pdf. Explanations, diagrams and extra practice are prepared for these notes.