
Revision and practice with answers
On this page 3 headings
Try these questions without looking at the answers. Then open each explanation and check your method, units and denominator.
One-page method guide
| Need | Method |
|---|---|
| Typical total per case | Mean = sum / count. |
| Middle numerical value | Sort; use middle value or average of two middles. |
| Most frequent value | Mode; report ties. |
| Spread of all values | Population divide by N; sample variance divide by n−1. |
| Original spread units | Take square root of variance for SD. |
| Percentiles | State hand rule or interpolation. |
| Middle-half spread | IQR = Q3−Q1, using one convention. |
Practice with explained answers
Try it yourself
1. Data: 2,2,3,4,4,4,5,6. Give a single-value frequency table.
Show explained answer
2:2, 3:1, 4:3, 5:1, 6:1. Total = 8. The share for 4 is 3/8 = 37.5%.
Try it yourself
2. For the same data, find mean, median and mode.
Show explained answer
Sum = 30, so mean = 30/8 = 3.75. Sorted middle values (positions 4 and 5) are both 4, so median = 4. Mode = 4 (3 times).
Try it yourself
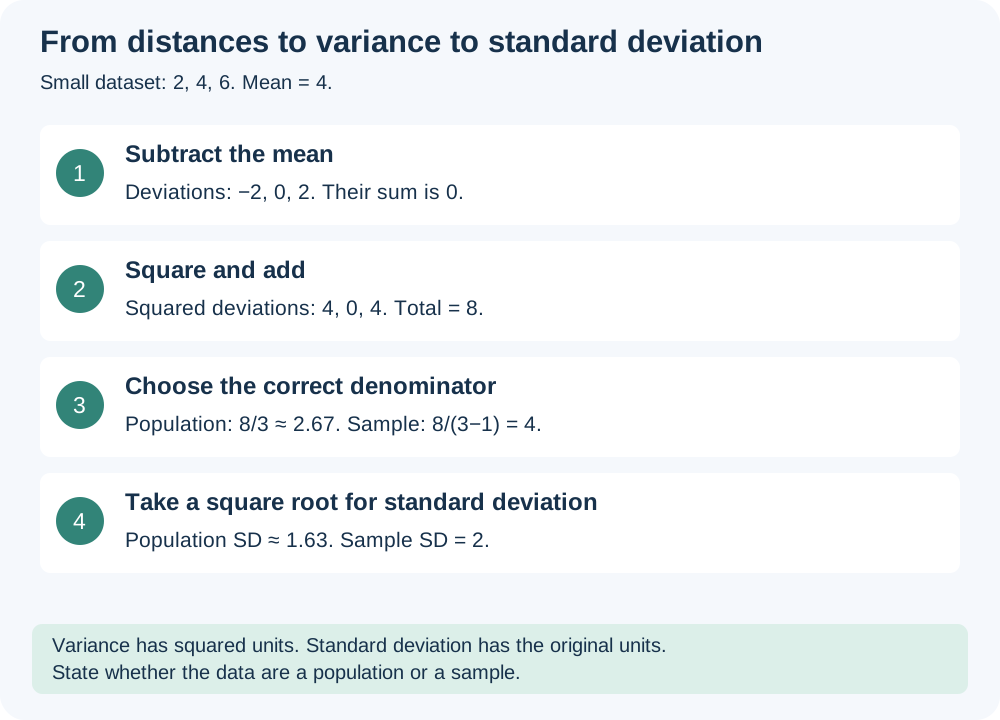
3. For population 2,4,6, find variance and SD.
Show explained answer
Mean = 4. Squared deviations total 8. Population variance = 8/3 ≈ 2.667; SD ≈ 1.633.
Try it yourself
4. For sample 2,4,6, find variance and SD.
Show explained answer
Use n−1 = 2: sample variance = 8/2 = 4 and SD = 2.
Try it yourself
5. A dataset has mean 20, variance 9 and SD 3. Each value becomes 5−2x. Give the new summaries.
Show explained answer
Mean = 5−2×20 = −35. Variance = (−2)²×9 = 36. SD = |−2|×3 = 6.
Try it yourself
6. Sorted data are 10,20,30,40,50,60. Find the 25th percentile by the hand rule.
Show explained answer
np = 6×0.25 = 1.5. Round up to position 2: percentile = 20.
Try it yourself
7. Use spreadsheet interpolation for the same percentile.
Show explained answer
Rank = 1 + 5×0.25 = 2.25. Interpolate: 20 + 0.25×(30−20) = 22.5.
Try it yourself
8. Q1 = 15, Q3 = 25. Find IQR, fences and whether 41 is flagged.
Show explained answer
IQR = 10. Fences = 0 and 40. Since 41 > 40, it is a potential outlier.
Try it yourself
9. A class [20,30) contains a measurement of 30. Is that right?
Show explained answer
No. Under the left-in, right-out rule, 30 belongs to [30,40).
Try it yourself
10. With key 3 | 4 = 34, interpret 5 | 0 1 1 8.
Show explained answer
50,51,51,58. The repeated 1 preserves the repeated value 51.
Try it yourself
11. Two bins have widths 5 and 10, with frequencies 10 each. Give frequency densities.
Show explained answer
10/5 = 2 and 10/10 = 1. Their bar areas are both 10.
Try it yourself
12. A group mean is 10 for 2 students, and another mean is 20 for 8 students. Find the combined mean.
Show explained answer
(2×10 + 8×20)/(2+8) = 180/10 = 18. Averaging group means without group sizes would give the wrong result 15.
Before moving on
Explain one result in a complete sentence with the group, unit and method. If your result disagrees with a spreadsheet, check the definition, sample/population denominator and percentile convention before changing your answer.