
Histograms and stem-and-leaf plots
On this page 4 headings
A graph helps you see where numerical observations cluster, how spread out they are, and whether there are unusual values. Two useful choices are a histogram and a stem-and-leaf plot.
Build a histogram step by step
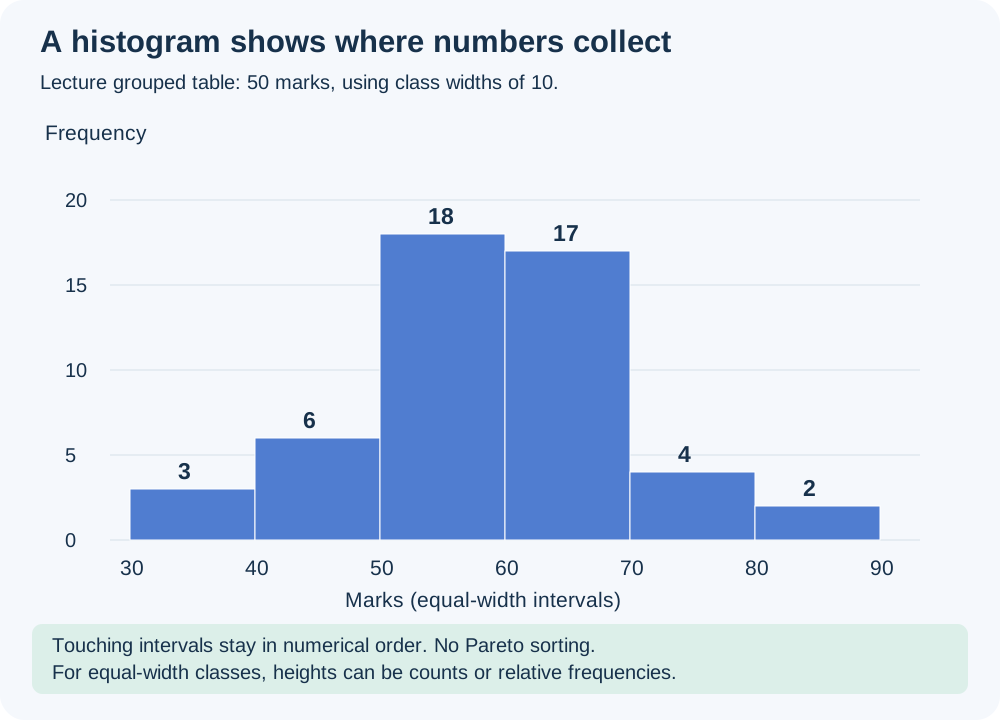
First make a frequency table. Put the numerical class boundaries on the horizontal axis. Put frequency or relative frequency on the vertical axis. For each equal-width interval, draw a bar whose height is its count or share. Adjacent intervals touch, and the intervals stay in numerical order.
In the lecture table the tallest bin is [50,60), with 18 of 50 cases. Together, [50,60) and [60,70) contain 35/50 = 70% of the cases. The graph does not tell you how many students scored exactly 55, because exact positions inside a bin have been lost.
Histogram versus bar chart
| Histogram | Categorical bar chart |
|---|---|
| Axis gives numerical intervals. | Axis gives category names. |
| Adjacent intervals normally touch. | Category bars have gaps. |
| Numerical order must be preserved. | Unordered categories can be rearranged. |
| Bin width and area matter. | Equal bar widths let lengths compare counts. |
The lecture’s count-height rule assumes equal-width classes. With unequal widths, use frequency density = frequency / class width so the bar AREA represents the count. A width-20 bin with 10 cases has density 0.5; a width-10 bin with 10 cases has density 1. They have the same area, despite different heights.
Read a numerical distribution
Look for the center, spread, shape and unusual values. A long tail toward large values is right-skewed; a long tail toward small values is left-skewed. A roughly balanced shape is symmetric. Check whether there is one main peak, more than one peak, gaps, or isolated values. Changing the bin width can change the apparent shape.
A stem-and-leaf plot keeps the original values
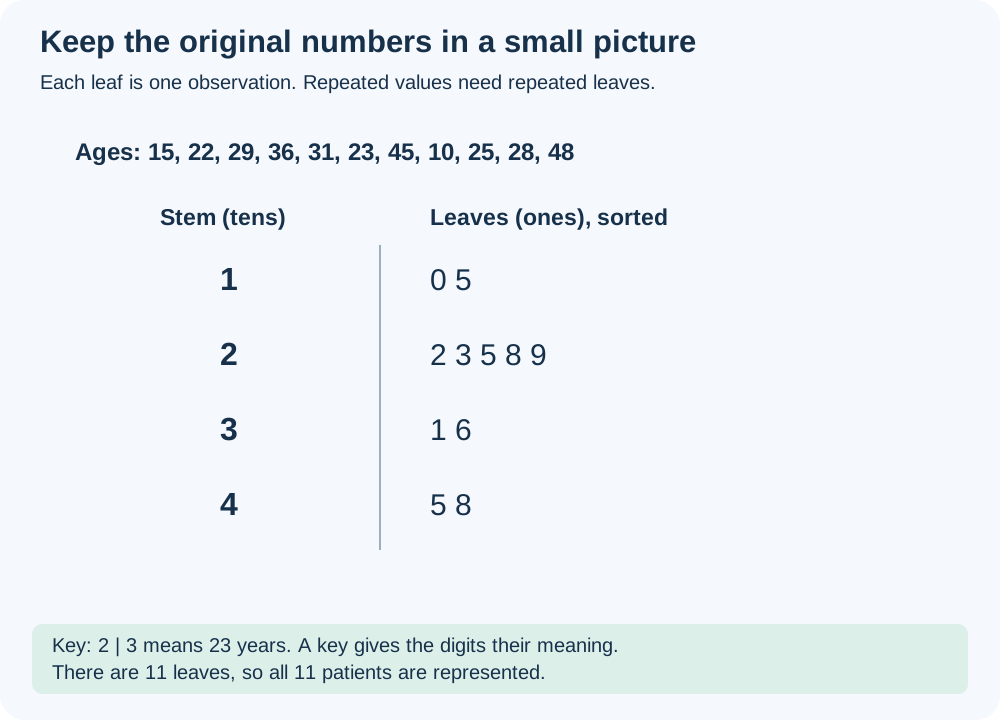
Use the lecture ages 15,22,29,36,31,23,45,10,25,28,48. Write stems 1,2,3,4 from smallest to largest. Put the ones digits beside the matching stem, then sort leaves within each row. There are 11 leaves for 11 observations.
Keep repeated leaves: ages 22,22,29 need stem 2 with leaves 2,2,9. Include a key so the scale is clear. With decimal data, a key such as 2 | 3 = 2.3 would mean something different. A stemplot suits small datasets; very large datasets can become crowded.
Try it yourself
The bar for [60,70) has height 17. Does this mean 17 students scored 65?
Show explained answer
No. It means 17 observations fall from 60 inclusive to 70 exclusive. Their exact marks are unknown from that bar.
Try it yourself
With key 7 | 5 = 75, what do stem 8 and leaves 0,2,2 mean?
Show explained answer
The observations are 80,82,82. Repeated leaves represent repeated observations.
Try it yourself
Two unequal-width bins both contain 12 cases. Must their histogram heights match?
Show explained answer
No. For an area-correct histogram, the wider bin has a lower frequency density. Their bar areas match.
Source: Lecture 3.1. Extra examples and diagrams are teaching material prepared for these notes.