
Spread: range, variance and standard deviation
On this page 6 headings
Two groups can have the same mean but feel very different. Spread tells us whether values stay close together or vary widely.
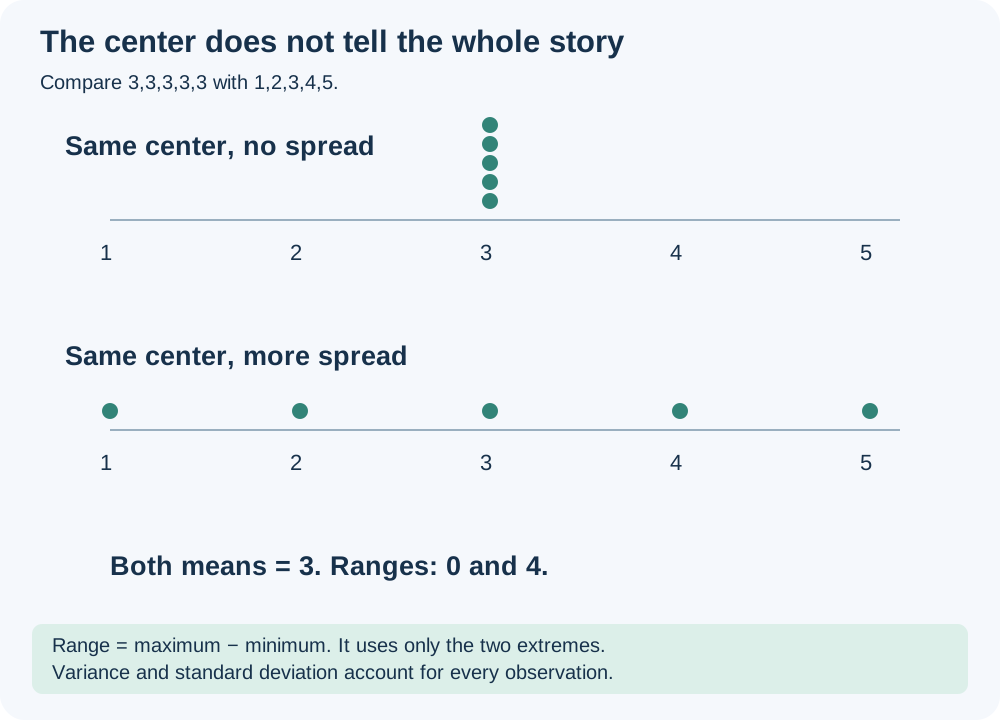
Range: largest minus smallest
For 3,3,3,3,3, range = 3−3 = 0. For 1,2,3,4,5, range = 5−1 = 4. Replacing the last value by 15 increases the range to 15−1 = 14. Range is easy to calculate but only uses the extremes.
Why not simply add deviations?
A deviation is a value minus its mean. Positive and negative deviations cancel: for 2,4,6 with mean 4, deviations are −2,0,2, whose sum is zero. Zero total deviation does not mean zero spread. Squaring makes all contributions nonnegative.
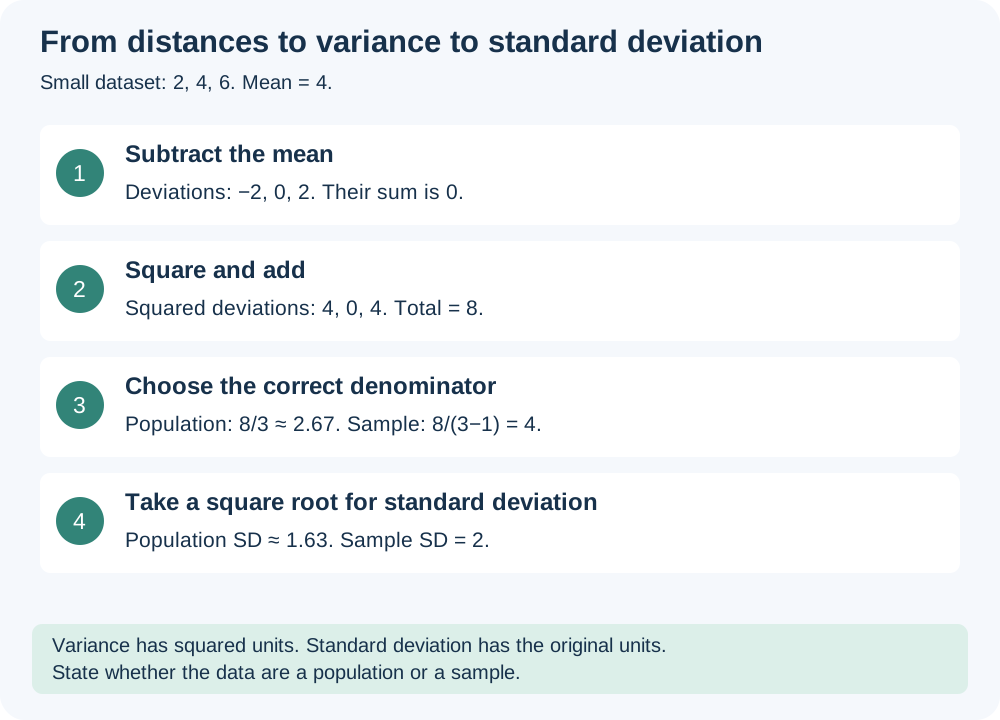
Population variance versus sample variance
Use N when describing the whole population as given. The course uses n−1 for sample variance when the data are a sample. Sample variance needs at least two observations. After estimating the sample mean, the deviations have to sum to zero, so one deviation is fixed by the others; this helps explain the n−1 correction.
Worked example: the ten marks
| Mark | Deviation from 59 | Squared deviation |
|---|---|---|
| 68 | 9 | 81 |
| 79 | 20 | 400 |
| 38 | -21 | 441 |
| 68 | 9 | 81 |
| 35 | -24 | 576 |
| 70 | 11 | 121 |
| 61 | 2 | 4 |
| 47 | -12 | 144 |
| 58 | -1 | 1 |
| 66 | 7 | 49 |
| Total | 0 | 1898 |
Population variance = 1898/10 = 189.8 marks². Sample variance = 1898/9 ≈ 210.889 marks². The dataset is the same; the denominator depends on the requested interpretation.
Source correction: the slide writes the deviation of 66 as −7. It is +7 because 66−59 = 7. Its square is still 49, so the displayed squared-deviation total 1898 remains correct.
Standard deviation returns to the original unit
Population SD = √189.8 ≈ 13.777 marks. Sample SD = √(1898/9) ≈ 14.522 marks. If the measurements were kilograms, variance would be kg² and standard deviation would be kg. Standard deviation is a measure of spread around the mean, not a statement that every observation lies exactly that far away.
What happens when every value changes?
| Change to every observation | Center | Range / SD | Variance |
|---|---|---|---|
| Add 5 | Increases by 5 | Unchanged | Unchanged |
| Multiply by 0.4 | Multiplied by 0.4 | Multiplied by 0.4 | Multiplied by 0.16 |
| Multiply by −2 | Multiplied by −2 | Multiplied by 2 | Multiplied by 4 |
For the marks multiplied by 0.4, sample variance = 0.16 × (1898/9) ≈ 33.7422 and sample SD ≈ 5.8088. Adding a constant shifts every point and its mean together, so distances do not change.
Try it yourself
For the population 1,3,5, find range, variance and SD.
Show explained answer
Mean = 3. Range = 4. Squared deviations are 4,0,4; population variance = 8/3 ≈ 2.667 and SD ≈ 1.633.
Try it yourself
Now treat 1,3,5 as a sample. What changes?
Show explained answer
Sample variance = 8/(3−1) = 4. Sample SD = 2. Range and mean are unchanged.
Try it yourself
If SD is 4 cm and each value is doubled then increased by 10 cm, what is the new SD?
Show explained answer
8 cm. Doubling doubles SD; adding 10 changes location only.
Source: Lecture 3.4. Extra examples and diagrams are teaching material prepared for these notes.