
Mean: ordinary, frequency-weighted and grouped
On this page 5 headings
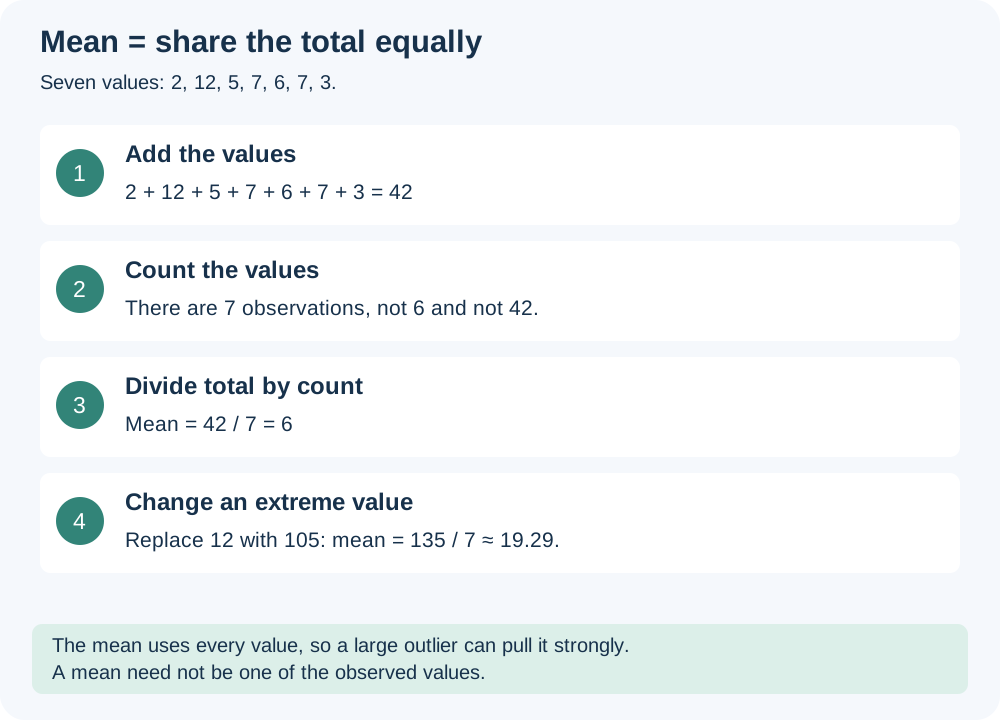
The mean is the total shared equally across all observations. It is often called the average. A measure of center tells us a typical location; it does not tell us the whole spread.
The symbols in plain English
x-bar is the sample mean, and n is the number of observations in the sample. Mu is the population mean, and N is the population size. The big sigma symbol means “add all these terms”. The same arithmetic works for measured values as well as counts.
Worked examples from the lecture
| Values | Total / count | Mean |
|---|---|---|
| 2,12,5,7,6,7,3 | 42/7 | 6 |
| 2,105,5,7,6,7,3 | 135/7 | ≈ 19.286 |
| 2,105,5,7,6,3 | 128/6 | ≈ 21.333 |
| 68,79,38,68,35,70,61,47,58,66 | 590/10 | 59 |
The mean need not appear in the data. For 1 and 2 children the mean is 1.5 children; it describes the average, not a possible half-child household. Large unusual values can move it strongly.
Mean from a single-value frequency table
Multiply each value by how often it occurs. Add those products. Divide by the total number of cases, not by the number of distinct values.
| Household size x | Frequency f | f × x |
|---|---|---|
| 1 | 2 | 2 |
| 2 | 3 | 6 |
| 3 | 5 | 15 |
| 4 | 4 | 16 |
| 5 | 1 | 5 |
| Total | 15 | 44 |
The household mean is 44/15 ≈ 2.933 people. Averaging 1,2,3,4,5 without frequencies would wrongly give every size the same weight.
Approximate mean from interval groups
When only intervals are known, replace every value in a class by its midpoint. This loses within-class detail, so the result is an estimate.
| Interval | f | Midpoint m | f × m |
|---|---|---|---|
| [30,40) | 3 | 35 | 105 |
| [40,50) | 6 | 45 | 270 |
| [50,60) | 18 | 55 | 990 |
| [60,70) | 17 | 65 | 1105 |
| [70,80) | 4 | 75 | 300 |
| [80,90) | 2 | 85 | 170 |
| Total | 50 | 2940 |
Estimated mean = 2940/50 = 58.8 marks. This belongs to the lecture’s 50-case grouped table; it is not an exact mean of the inconsistent 49-value printed list.
Change every value: what happens to the mean?
Adding 5 marks to each of the ten marks increases the mean from 59 to 64. Multiplying every mark by 0.4 changes the mean to 0.4 × 59 = 23.6. Multiplying by 0.4 means keeping 40% of the original, or reducing it by 60%; reducing by 40% would mean multiplying by 0.6.
Try it yourself
A value 10 occurs twice and 20 occurs three times. Find the mean.
Show explained answer
Total = 2×10 + 3×20 = 80; count = 5; mean = 80/5 = 16.
Try it yourself
Two classes have frequencies 3 and 1 and midpoints 5 and 15. Estimate the mean.
Show explained answer
(3×5 + 1×15)/(3+1) = 30/4 = 7.5. This is a midpoint estimate.
Try it yourself
A mean is 12. Every value is multiplied by 3 then increased by 2. New mean?
Show explained answer
3×12 + 2 = 38.
Source: Lecture 3.2. Extra examples and diagrams are teaching material prepared for these notes.