
Quartiles, IQR, five-number summaries and boxplots
On this page 4 headings
Quartiles divide ordered data into roughly four parts. Q1 is the 25th percentile, Q2 is the median, and Q3 is the 75th percentile. The interquartile range describes the spread of the middle half.
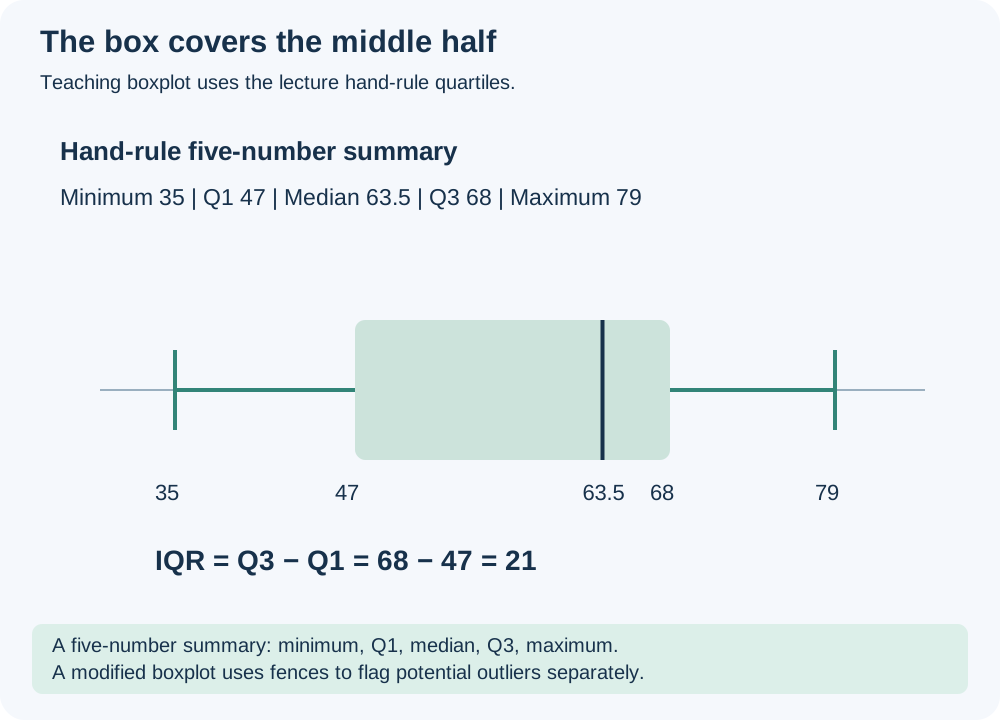
Five numbers describe position and spread
Write the minimum, Q1, median, Q3 and maximum, in that order. Use one percentile convention throughout.
| Summary | Hand rule | Spreadsheet interpolation |
|---|---|---|
| Minimum | 35 | 35 |
| Q1 | 47 | 49.75 |
| Median | 63.5 | 63.5 |
| Q3 | 68 | 68 |
| Maximum | 79 | 79 |
| IQR = Q3 − Q1 | 21 | 18.25 |
Using the lecture hand rule gives IQR = 68−47 = 21. The lecture later uses spreadsheet Q1 = 49.75, so its IQR is 68−49.75 = 18.25. The difference is a change of convention, not an arithmetic disagreement.
Why use IQR?
Range uses the two extremes. IQR uses the middle half, so it is more resistant to an extreme value. “Middle half” is approximate with small samples and ties. For skewed data or outliers, median and IQR often describe a typical case and spread better than mean and SD.
Read a boxplot
The box goes from Q1 to Q3. A line inside marks the median. A basic minimum-to-maximum boxplot uses whiskers at the minimum and maximum. A modified boxplot instead places whiskers at the most extreme observed values inside the fences and shows flagged values as separate points. Always check which version is used.
An extra tool: 1.5 × IQR outlier fences
A value strictly below the lower fence or above the upper fence is flagged as a potential outlier. A fence is a cutoff, not necessarily an observed value or a whisker endpoint. A flag asks you to investigate; it is not permission to delete data automatically.
With hand-rule Q1 = 47 and Q3 = 68, IQR = 21. Fences are 15.5 and 99.5. All ten marks lie inside, so none are flagged by this rule. If an additional value is added, recompute the quartiles and fences for the new dataset.
Another worked example: take 1,2,3,4,5,6,7,30. The hand rule gives Q1 = (2+3)/2 = 2.5 and Q3 = (6+7)/2 = 6.5. IQR = 4. Fences are −3.5 and 12.5, so 30 is flagged. Modified whiskers reach 1 and 7, not the upper fence 12.5.
Try it yourself
If Q1 = 20 and Q3 = 32, find IQR and the fences.
Show explained answer
IQR = 12. Lower fence = 20−18 = 2. Upper fence = 32+18 = 50.
Try it yourself
Using those fences, are 2,50,51 flagged?
Show explained answer
2 and 50 are on the fences, so not flagged by the strict rule. 51 is above 50, so it is flagged.
Try it yourself
Does a larger IQR always mean a larger mean?
Show explained answer
No. IQR describes spread; mean describes location. A group can be widely spread around a small mean.
Source: Lecture 3.5; boxplot extension from course overview objectives. Extra examples and diagrams are teaching material prepared for these notes.