
Try it: build and explore a small dataset
On this page 6 headings
This guided activity turns the Week 1 learning objectives into a practical routine. The dataset below is a small teaching example, not actual university admissions data.
| ID | Board | Class 12 marks /100 | Height (cm) |
|---|---|---|---|
| S01 | CBSE | 84 | 162 |
| S02 | State | 76 | 170 |
| S03 | CBSE | 91 | 158 |
| S04 | ISC | 88 | 166 |
| S05 | State | 82 | 172 |
1. Create or download a table
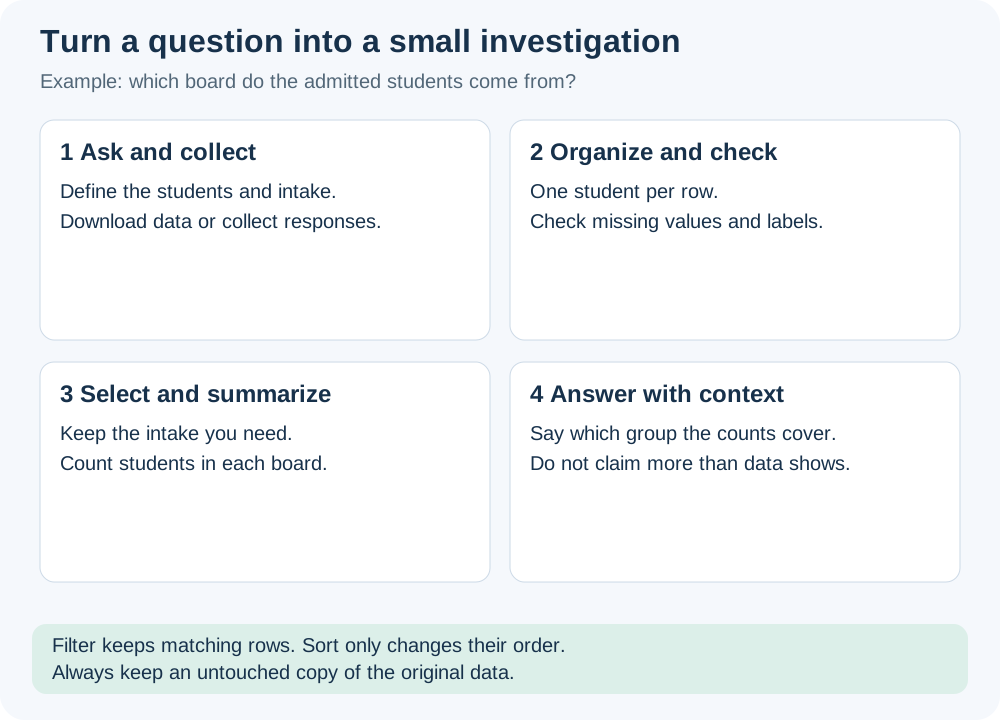
Enter the header once, then one student per row. If using an existing CSV file, open or import it into a spreadsheet and check that columns have separated correctly. Record the source, date, population covered, and units. Keep a copy before editing.
2. Check before calculating
Look for missing entries, accidental duplicate rows and inconsistent spellings. “CBSE”, “cbse” and “CBSE ” should not become three boards. Check whether 84 means marks out of 100 or a percentage. Do not silently treat a missing mark as zero.
3. Sort, filter and choose columns
Sorting by marks rearranges the rows. Always sort the whole table together so each student keeps their own board and height. Filtering Board = CBSE keeps S01 and S03: 2 cases. Selecting Board and Marks keeps 2 columns; it does not change how many rows are selected.
4. Ask questions the data can answer
| Question | Can this table answer it? |
|---|---|
| How many of these five students came from CBSE? | Yes: 2. |
| Which listed student has the highest marks? | Yes: S03 with 91. |
| What percentage of all Indian students use CBSE? | No: these five do not establish a national percentage. |
| Does a particular board cause higher marks? | No: this small observational table cannot establish causation. |
| How do marks change month by month? | No: there is no repeated monthly measurement. |
5. Explain the result with its scope
Say “2 of these 5 students are from CBSE”, rather than leaving the group unstated. A good answer includes the group studied, the variable, the unit or denominator, and any important limitation.
Try it yourself
If you filter marks of at least 85 in the teaching table, which rows remain?
Show explained answer
S03 (91) and S04 (88). Two cases remain, with all four recorded columns if no columns were removed.
More practice: apply what you learned
Try it yourself
In the five-student practice table, filter Board = State. Which students remain, and how many cases are there?
Show explained answer
S02 and S05 remain. There are 2 cases. Filtering selects rows; it does not turn Board into a new variable.
Try it yourself
A missing mark is entered as 0 so the table has no blanks. Why can this be a mistake?
Show explained answer
Zero means an actual score of zero; missing means the score is unknown. Replacing unknown marks with zero can lower the average and change conclusions. Keep missing values clearly identified.
Source: Week 1 learning objectives in Course Overview.pdf and Lectures 1.1–1.4.pdf. Explanations, diagrams and extra practice are prepared for these notes.