
Revision and practice with answers
On this page 4 headings
Use this page after the lessons. Attempt each question before opening its answer.
Quick revision
| Idea | Remember |
|---|---|
| Population / sample | Whole group / subgroup studied |
| Descriptive / inferential | Describe observed data / extend beyond it |
| Case / variable / value | Row unit / characteristic / cell entry |
| Categorical / numerical | Labels / amounts |
| Cross-sectional / time series | Snapshot / chronological sequence |
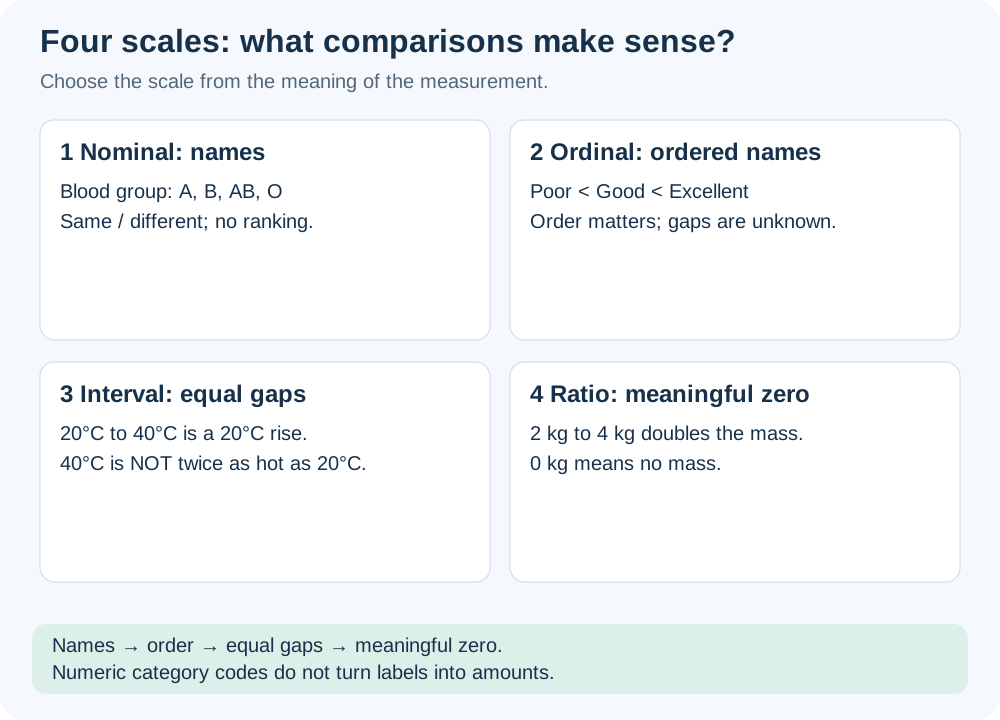
| Nominal / ordinal / interval / ratio | Names / order / equal gaps / meaningful zero |
Practice with explained answers
Try it yourself
1. A survey asks 40 of a college’s 800 students about commute time. Identify population, sample, case and variable.
Show explained answer
Population: the 800 students. Sample: the 40 asked. Case: one student. Variable: commute time, with a unit such as minutes.
Try it yourself
2. The mean commute time of those 40 is reported. Then it is used to estimate the college mean. Classify each step.
Show explained answer
Reporting the 40 is descriptive. Estimating the college mean is inferential.
Try it yourself
3. Classify board code, number of siblings, rank, Celsius temperature and height by scale.
Show explained answer
Board code: nominal. Sibling count: ratio. Rank: ordinal. Celsius: interval. Height: ratio.
Try it yourself
4. We record rainfall each day for a year. Is that cross-sectional?
Show explained answer
It is a time series. Preserve chronological order.
Try it yourself
5. A height column contains 170 cm and 1.65 m. What must be fixed?
Show explained answer
Convert to a common unit: 170 cm and 165 cm, for example.
Try it yourself
6. A spreadsheet is sorted only by moving the marks column. What can go wrong?
Show explained answer
Marks can become attached to the wrong student. Sort the whole table together.
Try it yourself
7. Is a mean of board codes useful?
Show explained answer
No. Board codes label categories; their average does not describe a meaningful board.
Try it yourself
8. Can a table with marks but no study-time column answer how study time relates to marks?
Show explained answer
No. The required variable was not recorded.
More practice: apply what you learned
Try it yourself
9. A city wants to know the travel time of all bus passengers this month, but interviews 200 passengers. Identify population and sample.
Show explained answer
Population: the bus passengers covered by the question this month. Sample: the 200 interviewed passengers. Place, time and eligibility define the population.
Try it yourself
10. A report says “12 of our 30 respondents prefer online classes.” Is this descriptive or inferential?
Show explained answer
Descriptive. It reports the responses actually observed. Saying the same proportion applies to every student would go beyond these data and be inferential.
Try it yourself
11. A researcher records every household in a village. Is this a sample survey or a census of those households?
Show explained answer
A census. Every household in the defined village population is included. A summary of their recorded data is still descriptive statistics.
Try it yourself
12. A file has 18 data rows and 5 columns. The first row above them contains headings. How many cases are there?
Show explained answer
18 cases, assuming one case per data row. The heading row names the variables and is not another case. There are 5 recorded columns.
Try it yourself
13. A table has one row per cricket match, with date, venue and runs scored. What is a case?
Show explained answer
One match. Date, venue and runs scored are recorded variables. A case need not be a person.
Try it yourself
14. Classify school name, shoe size, monthly rent and number of pets as categorical or numerical.
Show explained answer
School name is categorical. Shoe size, monthly rent and number of pets are numerical. Shoe size has a numerical scale; do not confuse it with ordered labels such as Small, Medium and Large.
Try it yourself
15. A survey uses 1 = bus, 2 = bicycle and 3 = walk. Can the mean code describe an average transport method?
Show explained answer
No. The values are nominal category codes. An average such as 1.8 does not name a meaningful transport method. Count the categories instead.
Try it yourself
16. Classify service ratings Poor, Fair, Good and Excellent by measurement scale. Can we assume equal gaps?
Show explained answer
Ordinal: the categories have an order. We cannot assume the improvement from Poor to Fair equals the improvement from Good to Excellent.
Try it yourself
17. A room changes from 10°C to 20°C. What numerical comparison is valid?
Show explained answer
The temperature increases by 10°C. It is not valid to say that 20°C is twice as hot in a ratio sense, because the Celsius zero is arbitrary.
Try it yourself
18. Classify elapsed time in seconds and finish position in a race.
Show explained answer
Elapsed time is ratio-scaled: equal time units and a meaningful zero. Finish position is ordinal: first, second and third give order but not the gaps in running time.
Try it yourself
19. Heights of different students are measured on Monday. Is this a time series just because Monday is mentioned?
Show explained answer
No. It is a snapshot across students at about one time. A date in the description does not by itself make data a time series.
Try it yourself
20. A column contains 2 meters and 150 centimeters. Express both in centimeters before comparison.
Show explained answer
2 meters = 200 centimeters. The comparable values are 200 cm and 150 cm. Keep one unit in the column heading.
Try it yourself
21. After filtering a dataset from 100 people to 25 people, how many cases are visible? Does the filter change their recorded values?
Show explained answer
25 cases are visible. A filter selects matching rows; it does not change the values recorded for those rows.
Try it yourself
22. A file has “State”, “state” and “State ” in its Board column. What should be checked?
Show explained answer
These may be the same board label with differences in capitalization or spaces. Standardize them carefully so one category is not accidentally counted as three.
Try it yourself
23. A table contains age and marks but no attendance information. Can it answer whether attendance is related to marks?
Show explained answer
No. Attendance was not recorded. You need the required variables paired for the same students before exploring their relationship.
Try it yourself
24. We ask 15 friends and estimate the preferences of every teenager in India. What makes that conclusion weak?
Show explained answer
The sample is small and selected from friends, who may share similar backgrounds or preferences. It is not automatically representative of all Indian teenagers.
Ready to move on?
Explain each answer in your own words. If you cannot explain the denominator, category order or measurement scale, revisit that lesson before continuing.