
Types of data: labels, amounts and time
On this page 5 headings
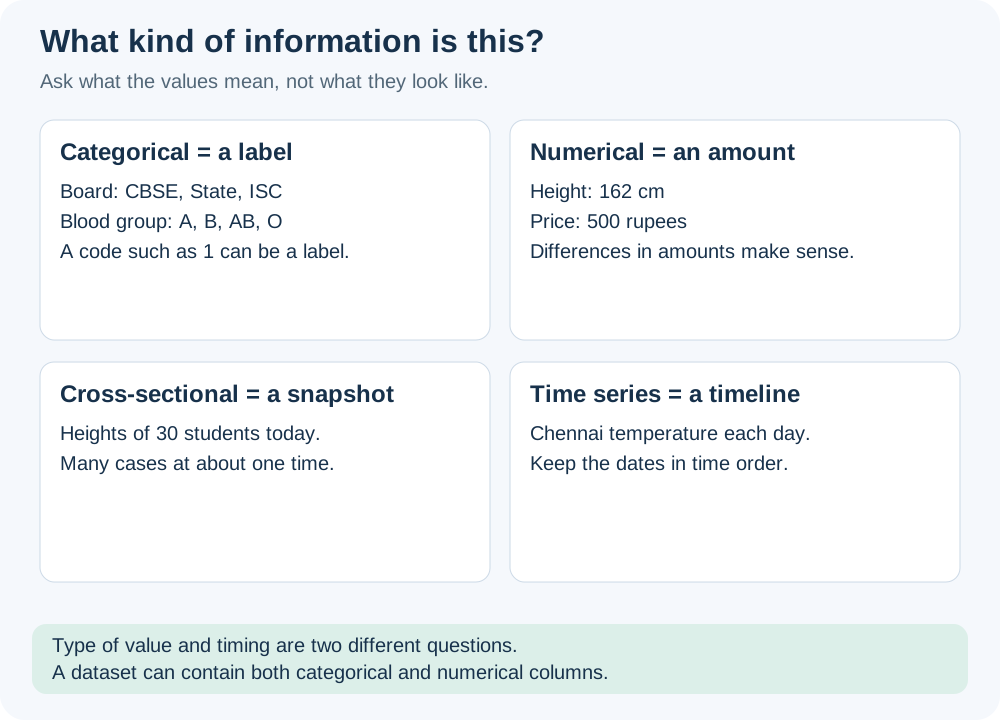
Data can be classified in more than one way. First ask whether a value is a label or an amount. Separately ask whether the observations are a snapshot or a sequence over time.
Categorical data: which group?
Categorical, or qualitative, data identify a group or category. Examples are board, blood group, and product type. A number can still be a category code: a roll number or a code for a board does not measure an amount.
Numerical data: how much or how many?
Numerical, or quantitative, data describe amounts. Examples are weight in kilograms, height in centimeters, price in rupees, and the number of siblings. Counts are often discrete; measured quantities can be continuous. This distinction will matter more later.
Numerical measurements need units. Convert before comparing: 1.6 meters and 160 centimeters are the same height. Storing both as 1.6 and 160 in a column labeled “cm” would create a false difference.
Cross-sectional data: a snapshot
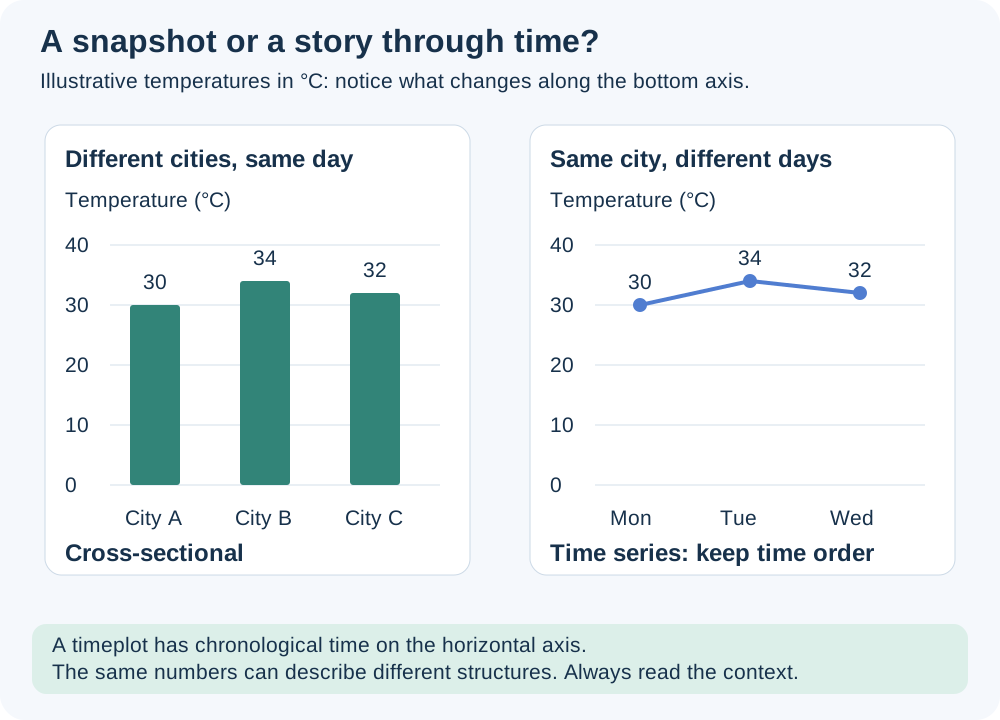
Cross-sectional data are observed for different cases at roughly the same time. Heights of 30 students measured today or house prices across a city for one period are examples.
Time-series data: follow time
A time series records a quantity over time, such as Chennai’s daily temperature during a month. A timeplot places time in chronological order along the horizontal axis and the recorded value on the vertical axis. Sorting the dates by temperature would hide the time pattern.
| Recorded information | Value type | Timing |
|---|---|---|
| Blood groups of a class today | Categorical | Cross-sectional |
| Heights of that class today | Numerical | Cross-sectional |
| Chennai temperature each day in June | Numerical | Time series |
| Daily weather category: sunny/rainy/cloudy | Categorical | Recorded over time |
Try it yourself
A board is coded State = 1, CBSE = 2, ISC = 3. Is board numerical?
Show explained answer
No. The numbers are labels; their arithmetic differences do not measure a real difference between boards.
Try it yourself
The price of the same item recorded every month: what type is it?
Show explained answer
Price is numerical, measured in currency; monthly recording makes it a time series.
More practice: apply what you learned
Try it yourself
Classify number of books, favorite book genre and reading time in minutes.
Show explained answer
Number of books: numerical count. Favorite genre: categorical label. Reading time: numerical measurement with minutes as its unit.
Try it yourself
We record the temperatures of ten cities on one date. Then we record one city’s temperature on ten dates. How do the structures differ?
Show explained answer
Ten cities on one date form a cross-sectional snapshot. One city on ten dates forms a time series, which should stay in chronological order.
Source: Lecture 1.3.pdf. Explanations, diagrams and extra practice are prepared for these notes.