
Start here: what this course helps you do
On this page 4 headings
Statistics helps us learn from data. You do not need advanced maths to begin. Start with a question, collect useful information, organize it, and explain what it tells you.
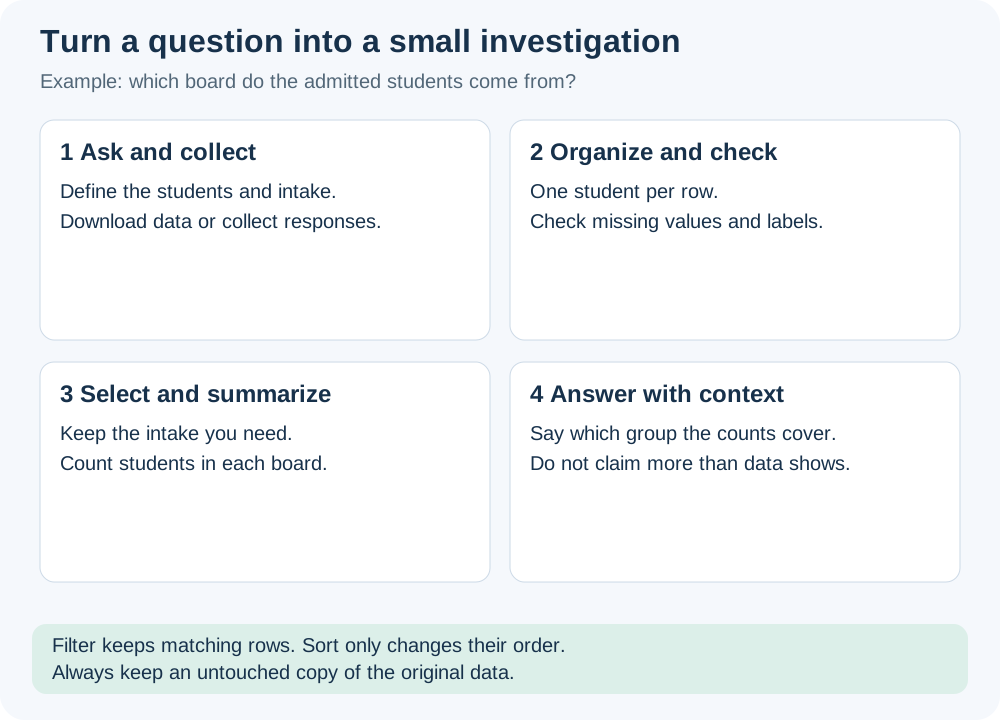
One story for the whole course
Imagine a university admission form. Each student gives their board, age, Class 10 marks and Class 12 marks. These answers form a dataset. We can ask how many students came from each board, what the typical marks were, and whether two sets of marks are related.
The course roadmap
| Overview schedule | What you will learn | Example question |
|---|---|---|
| Week 1 | Data, cases, variables, types and scales | What does one row represent? |
| Week 2 | Categorical tables, charts, mode and median | How many students came from each board? |
| Week 3 | Numerical graphs; mean, median, mode; range, variance, standard deviation; percentiles, IQR and five-number summary; outliers | What are typical marks, and how spread out are they? |
| Week 4 | Association; contingency tables, scatter plots and correlation; categorical versus numerical comparisons | Do higher Class 10 marks go with higher Class 12 marks? |
| Week 5 | Counting, factorials, permutations and combinations | How many committees of 3 can we choose from 10? |
| Weeks 6–7 | Experiments, sample spaces, events, probability laws, trees, conditional probability and independence | What is the chance of a top grade, given a board? |
| Weeks 8–9 | Discrete and continuous random variables; PMF, CDF, expectation and variance | What is the chance of exactly 2 siblings? |
| Week 10 | Binomial distribution | If we guess 25 four-option answers, how many may be correct? |
| Weeks 11–12 | Density, normal distribution, empirical rule and standard normal | What is the chance a test takes 30–45 minutes? |
This roadmap follows the supplied Course Overview. Only Weeks 1 and 2 are taught in this new subject so far; later topics are a preview, not prerequisites.
How to study these notes
Look at the diagram first. Read the explanation underneath. Work the example yourself, then open the quick-check answer. Keep asking: who is being studied, what was recorded, and what can the data really answer?
Try it yourself
Does learning statistics begin by memorizing formulas?
Show explained answer
No. Begin by understanding the question, the cases and the meaning of the recorded values.
More practice: apply what you learned
Try it yourself
A shop records the number of notebooks sold each day. Give one question these data can answer.
Show explained answer
For example: “Which recorded day had the highest notebook sales?” Each day is a case and the number sold is a numerical variable.
Try it yourself
You have collected survey answers. What should you do before calculating anything?
Show explained answer
Check what each row represents, name the columns, record the units, and look for missing or inconsistent entries. A calculation is useful only when the values have a clear meaning.
Source: Course Overview.pdf. Explanations, diagrams and extra practice are prepared for these notes.